Matplotlib是Python中的一個庫,它是數字的-NumPy庫的數學擴展。 Pyplot是Matplotlib模塊的基於狀態的接口,該模塊提供了MATLAB-like接口。
matplotlib.pyplot.ylabel()函數
matplotlib庫的pyplot模塊中的ylabel()函數用於設置x軸的標簽。
用法: matplotlib.pyplot.ylabel(ylabel, fontdict=None, labelpad=None, **kwargs)
參數:此方法接受以下描述的參數:
- ylabel:此參數是標簽文本。並包含字符串值。
- labelpad:此參數用於與軸邊界框的點間距,包括刻度和刻度標簽,其默認值為“無”。
- **kwargs:此參數是文本屬性,用於控製標簽的外觀。
以下示例說明了matplotlib.pyplot中的matplotlib.pyplot.ylabel()函數:
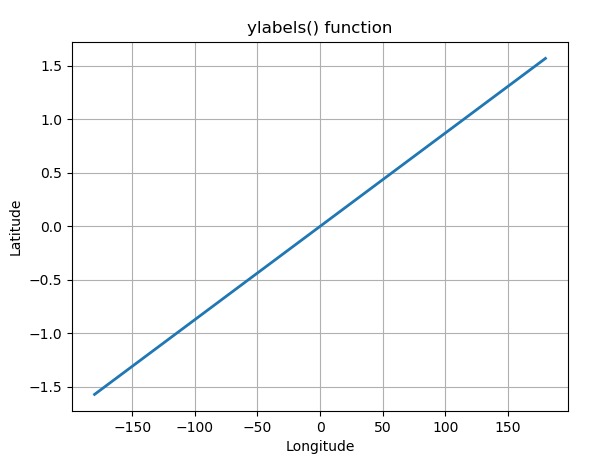
範例1:
# Implementation of matplotlib.pyplot.ylabels()
# function

import numpy as np
import matplotlib.pyplot as plt

t = np.arange(-180.0, 180.0, 0.1)
s = np.radians(t)/2.

plt.plot(t, s, '-', lw = 2)

plt.xlabel('Longitude')
plt.ylabel('Latitude')
plt.title('ylabels() function')
plt.grid(True)

plt.show()
輸出:
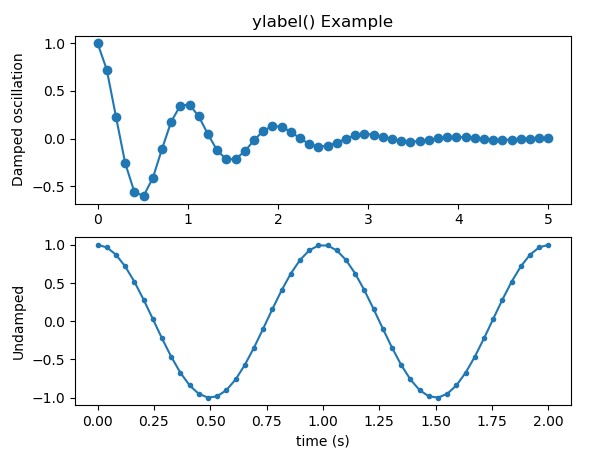
範例2:
# Implementation of matplotlib.pyplot.ylabels()
# function

import numpy as np
import matplotlib.pyplot as plt

valx1 = np.linspace(0.0, 5.0)
x2 = np.linspace(0.0, 2.0)

valy1 = np.cos(2 * np.pi * valx1) * np.exp(-valx1)
y2 = np.cos(2 * np.pi * x2)

plt.subplot(2, 1, 1)
plt.plot(valx1, valy1, 'o-')
plt.title('ylabel() Example')
plt.ylabel('Damped oscillation')

plt.subplot(2, 1, 2)
plt.plot(x2, y2, '.-')
plt.xlabel('time (s)')
plt.ylabel('Undamped')

plt.show()
輸出:
相關用法
注:本文由純淨天空篩選整理自SHUBHAMSINGH10大神的英文原創作品 Matplotlib.pyplot.ylabels() in Python。非經特殊聲明,原始代碼版權歸原作者所有,本譯文未經允許或授權,請勿轉載或複製。