Matplotlib是Python中的一個庫,它是數字的-NumPy庫的數學擴展。 Pyplot是Matplotlib模塊的基於狀態的接口,該模塊提供了MATLAB-like接口。
matplotlib.pyplot.xticks()函數
matplotlib庫的pyplot模塊中的annotate()函數用於獲取和設置x軸的當前刻度位置和標簽。
用法:
matplotlib.pyplot.xticks(ticks=None, labels=None, **kwargs)
參數:此方法接受以下描述的參數:
- ticks:此參數是xtick位置的列表。和一個可選參數。如果將一個空列表作為參數傳遞,則它將刪除所有xticks
- labels:此參數包含放置在給定刻度線位置的標簽。它是一個可選參數。
- **kwargs:此參數是文本屬性,用於控製標簽的外觀。
返回值:這將返回以下內容:
- 位置:這將返回ytick位置列表。
- 標簽:這將返回ylabel Text對象的列表。
結果是(位置,標簽)
以下示例說明了matplotlib.pyplot中的matplotlib.pyplot.xticks()函數:
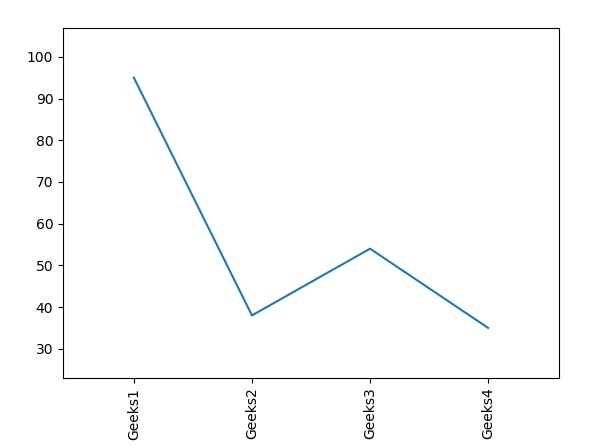
範例1:
# Implementation of matplotlib.pyplot.xticks()
# function

import numpy as np
import matplotlib.pyplot as plt

x = [1, 2, 3, 4]
y = [95, 38, 54, 35]
labels = ['Geeks1', 'Geeks2', 'Geeks3', 'Geeks4']

plt.plot(x, y)

# You can specify a rotation for the tick
# labels in degrees or with keywords.
plt.xticks(x, labels, rotation ='vertical')

# Pad margins so that markers don't get
# clipped by the axes
plt.margins(0.2)

# Tweak spacing to prevent clipping of tick-labels
plt.subplots_adjust(bottom = 0.15)
plt.show()
輸出:
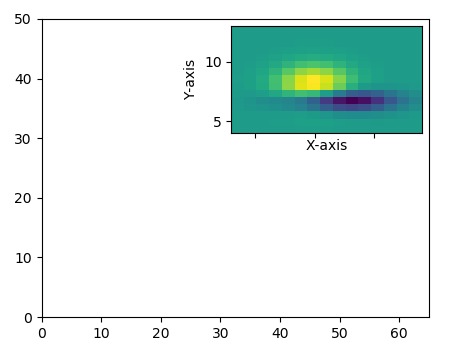
範例2:
# Implementation of matplotlib.pyplot.xticks()
# function

import matplotlib.pyplot as plt

from mpl_toolkits.axes_grid1.inset_locator import inset_axes, zoomed_inset_axes

def get_demo_image():
    from matplotlib.cbook import get_sample_data
    import numpy as np
    f = get_sample_data("axes_grid / bivariate_normal.npy",
                        asfileobj = False)
    z = np.load(f)

    # z is a numpy array of 15x15
    return z, (3, 19, 4, 13)


fig, ax = plt.subplots(figsize =[5, 4])

Z, extent = get_demo_image()

ax.set(aspect = 1,
       xlim =(0, 65),
       ylim =(0, 50))


axins = zoomed_inset_axes(ax, zoom = 2,
                          loc ='upper right')

im = axins.imshow(Z, extent = extent,
                  interpolation ="nearest",
                  origin ="upper")

plt.xlabel('X-axis')
plt.ylabel('Y-axis')

plt.xticks(visible = False)
plt.show()
輸出:
相關用法
注:本文由純淨天空篩選整理自SHUBHAMSINGH10大神的英文原創作品 Matplotlib.pyplot.xticks() in Python。非經特殊聲明,原始代碼版權歸原作者所有,本譯文未經允許或授權,請勿轉載或複製。