Matplotlib是Python中的一個庫,它是數字的-NumPy庫的數學擴展。 Pyplot是Matplotlib模塊的基於狀態的接口,該模塊提供了MATLAB-like接口。在Pyplot中可以使用各種圖,例如線圖,輪廓圖,直方圖,散點圖,3D圖等。#示例代碼
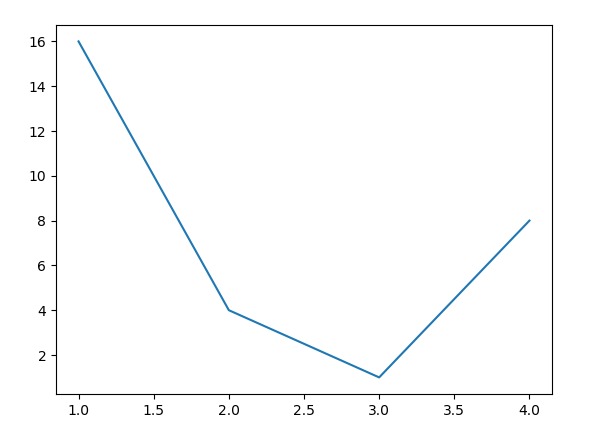
# sample code
import matplotlib.pyplot as plt

plt.plot([1, 2, 3, 4], [16, 4, 1, 8])
plt.show()
輸出:
matplotlib.pyplot.xlim()函數
matplotlib庫的pyplot模塊中的xlim()函數用於獲取或設置當前軸的x-limits。句法:
matplotlib.pyplot.xlim(*args, **kwargs)
參數:此方法接受以下描述的參數:
- left:此參數用於將xlim設置為左側。
- right:此參數用於將xlim設置為正確。
- **kwargs:此參數是文本屬性,用於控製標簽的外觀。
返回值:這將返回以下內容:
- left, right:這將返回新的x軸限製的元組。
以下示例說明了matplotlib.pyplot中的matplotlib.pyplot.ylim()函數:
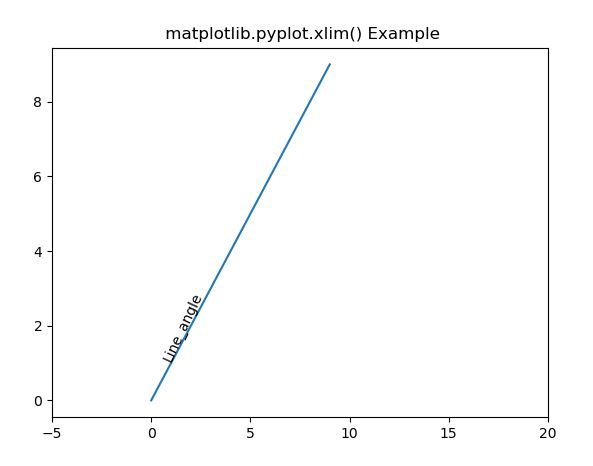
示例1:
# Implementation of matplotlib function
import matplotlib.pyplot as plt
import numpy as np

h = plt.plot(np.arange(0, 10), np.arange(0, 10))
plt.xlim([-5, 20])
l1 = np.array((1, 1))
angle = 65

th1 = plt.text(l1[0], l1[1], 'Line_angle',
               fontsize = 10, rotation = angle,
               rotation_mode ='anchor')

plt.title(" matplotlib.pyplot.xlim() Example")
plt.show()
輸出:
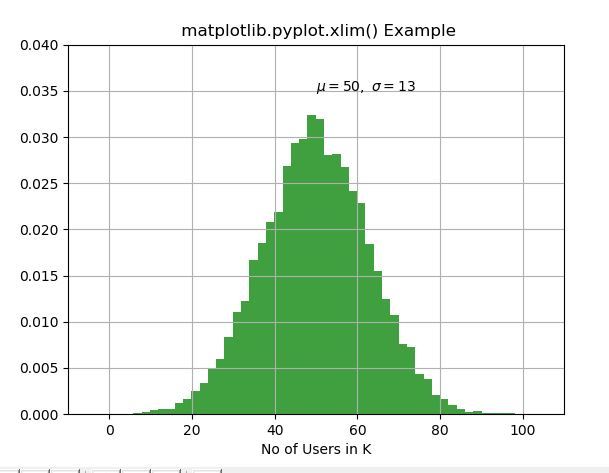
示例2:
# Implementation of matplotlib function
import matplotlib.pyplot as plt
import numpy as np

np.random.seed(9680801)

mu, sigma = 50, 13
x = mu + sigma * np.random.randn(10000)

# the histogram of the data
n, bins, patches = plt.hist(x, 50,
                            density = True,
                            facecolor ='g',
                            alpha = 0.75)


plt.xlabel('No of Users in K')
plt.title('Histogram of IQ')
plt.text(50, .035, r'$\mu = 50, \
         \ \sigma = 13$')

plt.xlim(-10, 110)
plt.ylim(0, 0.04)

plt.grid(True)
plt.title(" matplotlib.pyplot.xlim() Example")
plt.show()
輸出:
相關用法
注:本文由純淨天空篩選整理自SHUBHAMSINGH10大神的英文原創作品 Matplotlib.pyplot.xlim() in Python。非經特殊聲明,原始代碼版權歸原作者所有,本譯文未經允許或授權,請勿轉載或複製。