Matplotlib基於NumPy和備用框架構建,這就是為什麽它快速高效的原因。它是開源的,具有巨大的社區支持。它具有與許多操作係統和圖形後端兼容的能力。得到什麽matplotlib.pyplot.xcorr()我們需要了解Cross-Correlation嗎?
交叉相關
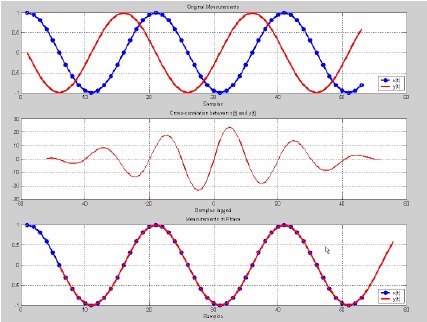
相關係數是兩個變量相對運動之間關係強度的統計量度。
例如:讓我們采用兩個實值函數f和g。 g在x處是沿x軸的差。現在使用交叉相關計算。
matplotlib.pyplot.xcorr()
matplotlib.pyplot.xcorr()函數繪製兩個數組列表之間的交叉相關。
參數:
| 參數 | 輸入類型 | 描述 |
|---|---|---|
| x | 實數或複數浮點數的向量。 | 互相關的第一個變量。 |
| y | 實數或複數浮點數的向量。默認值為x。 | 互相關的第二個變量。 |
| detrend | callable | x和y被可調用的下降趨勢所下降。這必須是一個函數x = detrend(x)接受並返回numpy.array。這是可選參數,默認為不規範。 |
| normed | bool | 如果為True,則將輸入向量歸一化為單位長度。 |
| usevlines | bool | 如果為True,則使用軸從0到xcorr值繪製垂直線。它是一個可選參數 |
| maxlags | int | 顯示的滯後次數。如果為None,將返回所有2 * len(x)-1個滯後。可選參數,默認值為10。 |
返回:
| 參數 | 類型 | 描述 |
|---|---|---|
| lags | 數組(長度2 * maxlags + 1) | 滯後向量。 |
| c | 數組(長度2 * maxlags + 1) | 自動相關向量。 |
| line | LineCollection或Line2D | 藝術家添加到關聯的軸: 1.如果usevlines為True,則為LineCollection。 2.如果usevlines為False,則為Line2D。 |
| b | Line2D或無 | 如果usevlines為True,則水平線為0。usevlines為False。 |
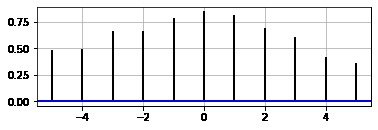
範例1:
# import matplotlib lirary
import matplotlib.pyplot as plt
import numpy as np

# float lists for cross
# correlation
x=[11.37, 14.23, 16.3, 12.36,
   6.54, 4.23, 19.11, 12.13,
   19.91, 11.00]

y=[15.21, 12.23, 4.76, 9.89,
   8.96, 19.26, 12.24, 11.54,
   13.39, 18.96]

# Plot graph
fig = plt.figure()
ax1 = fig.add_subplot(211)

# cross correlation using
# xcorr() function
ax1.xcorr(x, y, usevlines=True,
          maxlags=5, normed=True,
          lw=2)
# adding grid to the graph
ax1.grid(True)
ax1.axhline(0, color='blue', lw=2)

# show final plotted graph
plt.show()
輸出:
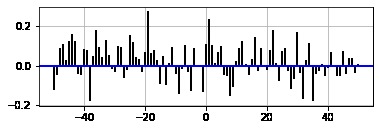
範例2:
# import matplotlib lirary
import matplotlib.pyplot as plt
import numpy as np

# float lists for cross
# correlation
x, y = np.random.randn(2, 100)

# Plot graph
fig = plt.figure()
ax1 = fig.add_subplot(211)

# cross correlation using xcorr()
# function
ax1.xcorr(x, y, usevlines=True,
          maxlags=50, normed=True,
          lw=2)

# adding grid to the graph
ax1.grid(True)
ax1.axhline(0, color='blue', lw=2)

# show final plotted graph
plt.show()
輸出:
相關用法
注:本文由純淨天空篩選整理自RahulSabharwal大神的英文原創作品 Matplotlib.pyplot.xcorr() in Python。非經特殊聲明,原始代碼版權歸原作者所有,本譯文未經允許或授權,請勿轉載或複製。