Matplotlib是Python中的一個庫,它是數字的-NumPy庫的數學擴展。 Pyplot是Matplotlib模塊的基於狀態的接口,該模塊提供了MATLAB-like接口。在Pyplot中可以使用各種圖,例如線圖,輪廓圖,直方圖,散點圖,3D圖等。
matplotlib.pyplot.triplot()函數:
matplotlib庫的pyplot模塊中的triplot()函數用於繪製非結構化的三角形網格作為線和/或標記。
用法: matplotlib.pyplot.triplot(*args, **kwargs)
參數:此方法接受以下描述的參數:
- x, y:這些參數是要繪製的數據的x和y坐標。
- triangulation:此參數是matplotlib.tri.Triangulation對象。
- **kwargs:此參數是文本屬性,用於控製標簽的外觀。
其餘所有args和kwargs與matplotlib.pyplot.plot()相同。
返回值:這將返回包含以下內容的2 Line2D的列表:
- 為三角形邊繪製的線。
- 為三角形節點繪製的標記
以下示例說明了matplotlib.pyplot中的matplotlib.pyplot.triplot()函數:
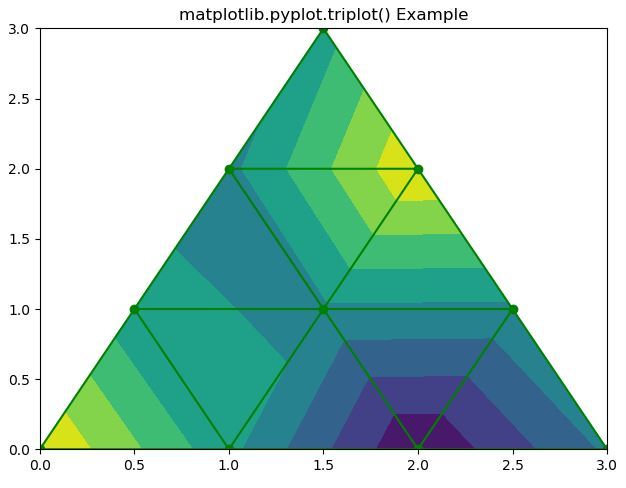
範例1:
# Implementation of matplotlib function
import matplotlib.pyplot as plt
import matplotlib.tri as mtri
import numpy as np

# Create triangulation.
x = np.asarray([0, 1, 2, 3, 0.5, 1.5,
                2.5, 1, 2, 1.5])

y = np.asarray([0, 0, 0, 0, 1.0,
                1.0, 1.0, 2, 2, 3.0])

triangles = [[0, 1, 4], [1, 2, 5],
             [2, 3, 6], [1, 5, 4],
             [2, 6, 5], [4, 5, 7],
             [5, 6, 8], [5, 8, 7],
             [7, 8, 9]]

triang = mtri.Triangulation(x, y, triangles)
z = np.cos(1.5 * x) * np.cos(1.5 * y)

plt.tricontourf(triang, z)
plt.triplot(triang, 'go-')

plt.title('matplotlib.pyplot.triplot() Example')
plt.show()
輸出:
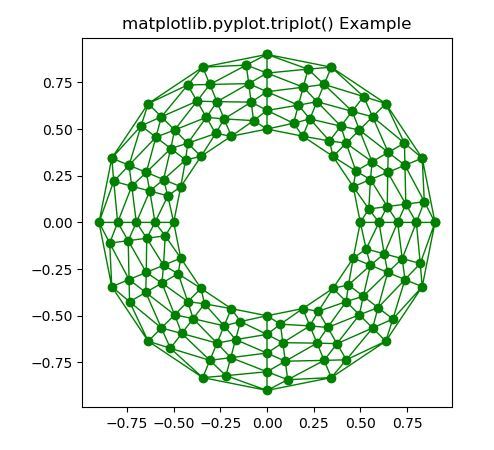
範例2:
# Implementation of matplotlib function
import matplotlib.pyplot as plt
import matplotlib.tri as tri
import numpy as np

n_angles = 24
n_radii = 9
min_radius = 0.5
radii = np.linspace(min_radius, 0.9,
                    n_radii)

angles = np.linspace(0, 3 * np.pi, n_angles,
                     endpoint = False)

angles = np.repeat(angles[..., np.newaxis],
                   n_radii, axis = 1)

angles[:, 1::2] += np.pi / n_angles

x = (radii * np.cos(angles)).flatten()
y = (radii * np.sin(angles)).flatten()
triang = tri.Triangulation(x, y)

triang.set_mask(np.hypot(x[triang.triangles].mean(axis = 1),
                         y[triang.triangles].mean(axis = 1))
                < min_radius)

plt.triplot(triang, 'go-', lw = 1)
plt.title('matplotlib.pyplot.triplot() Example')
plt.show()
輸出:
注:本文由純淨天空篩選整理自SHUBHAMSINGH10大神的英文原創作品 Matplotlib.pyplot.triplot() in python。非經特殊聲明,原始代碼版權歸原作者所有,本譯文未經允許或授權,請勿轉載或複製。