此函數用於將文本添加到數據坐標中x,y位置的軸上。
用法: matplotlib.pyplot.text(x, y, s, fontdict=None, **kwargs)
| 參數 | 描述 |
| x,y:float | 放置文本的位置。默認情況下,這是在數據坐標中。可以使用變換參數來更改坐標係。 |
| s:str | 文本。 |
| fontdict:dict默認無 | 用於覆蓋默認文本屬性的字典。如果fontdict為None,則默認值由rcParams確定。 |
| **誇克 | 文字屬性。 |
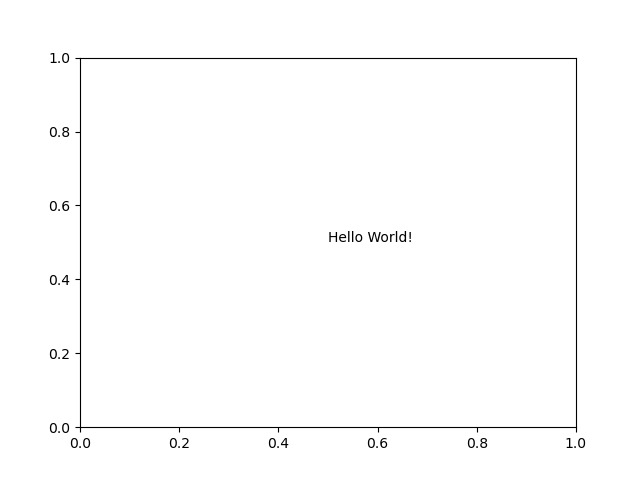
範例1:圖紙上的文字
Python3
import matplotlib.pyplot

matplotlib.pyplot.text(0.5, 0.5, "Hello World!")
matplotlib.pyplot.savefig("out.png")
輸出:
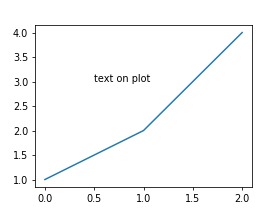
範例2:向繪圖添加文字
Python3
import matplotlib.pyplot as plt


w = 4
h = 3
d = 70

plt.figure(figsize=(w, h), dpi=d)

x = [1, 2, 4]
x_pos = 0.5
y_pos = 3

plt.text(x_pos, y_pos, "text on plot")
plt.plot(x)
plt.savefig("out.png")
輸出:
相關用法
- Python Wand function()用法及代碼示例
- Python Sorted()用法及代碼示例
- Python Numbers choice()用法及代碼示例
- Python Tkinter askopenfile()用法及代碼示例
- Python ord()用法及代碼示例
- Python round()用法及代碼示例
- Python id()用法及代碼示例
- Python vars()用法及代碼示例
注:本文由純淨天空篩選整理自deepaksingh20899大神的英文原創作品 Matplotlib.pyplot.text() function in Python。非經特殊聲明,原始代碼版權歸原作者所有,本譯文未經允許或授權,請勿轉載或複製。