先決條件:matplotlib
subplot()函數將子圖添加到指定網格位置處的當前圖形。它類似於subplots()函數,但是與subplots()不同,它一次添加一個子圖。因此,要創建多個圖,您將需要使用subplot()函數的幾行代碼。子圖函數的另一個缺點是,它會刪除圖形上先前存在的圖。請參考示例1。
它是Figure.add_subplot的包裝。
用法:
子圖(nrows,ncols,index,** kwargs)
子圖(pos,** kwargs)
子圖(ax)
Parameters:
- args: 3位整數或三個單獨的整數描述子圖的位置。
- pos是一個three-digit整數,其中第一個,第二個和第三個整數是nrows,ncols,index。
- projection:[{None,“ aito ff”,“ hammer”,“ lambert”,“ mollweide”,“ polar”,“ rectalinear”,str},可選)。子圖的projection-type(軸)。默認值為“無”會導致“直線”投影。
- label:[str]返回軸的標簽。
- **kwargs:此方法還為返回的軸基類采用關鍵字參數。
除了數字參數,例如facecolor。
返回值:軸的axes.SubplotBase子類或軸的子類。返回的軸基類取決於所使用的投影。
該函數的實現如下:
範例1:subplot()將刪除先前存在的繪圖。
Python3
# importing hte module
import matplotlib.pyplot as plt

# Data to display on plot
x = [1, 2, 3, 4, 5]
y = [1, 2, 1, 2, 1]

# plot() will create new figure and will add axes object (plot) of above data
plt.plot(x, y, marker="x", color="green")

# subplot() will add plot to current figure deleting existing plot
plt.subplot(121)輸出:我們可以看到,第一個繪圖被subplot()函數擱置了。
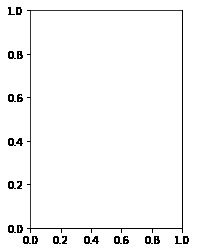
subplot_gfg
如果要查看第一幅圖,請注釋出plt.subplot()行,您將看到以下圖
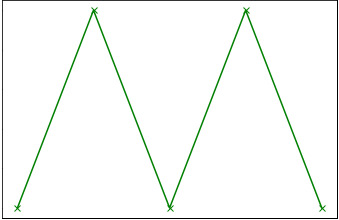
plot_gfg
範例2:
Python3
import matplotlib.pyplot as plt
# data to display on plots

x = [3, 1, 3]
y = [3, 2, 1]
z = [1, 3, 1]

# Creating figure object
plt.figure()

# addind first subplot
plt.subplot(121)
plt.plot(x, y, color="orange", marker="*")

# addding second subplot
plt.subplot(122)
plt.plot(z, y, color="yellow", marker="*")
輸出:
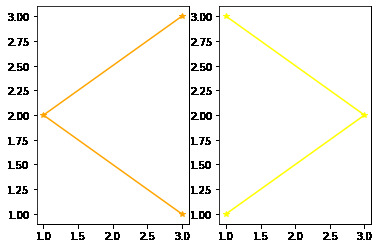
multiple_subplots
相關用法
- Python Wand function()用法及代碼示例
- Python Sorted()用法及代碼示例
- Python Numbers choice()用法及代碼示例
- Python Tkinter askopenfile()用法及代碼示例
- Python ord()用法及代碼示例
- Python round()用法及代碼示例
- Python id()用法及代碼示例
注:本文由純淨天空篩選整理自tejalkadam18m大神的英文原創作品 Matplotlib.pyplot.subplot() function in Python。非經特殊聲明,原始代碼版權歸原作者所有,本譯文未經允許或授權,請勿轉載或複製。