Matplotlib是Python中的一個庫,它是數字的-NumPy庫的數學擴展。 Pyplot是Matplotlib模塊的基於狀態的接口,該模塊提供了MATLAB-like接口。在Pyplot中可以使用各種圖,例如線圖,輪廓圖,直方圖,散點圖,3D圖等。
matplotlib.pyplot.set_cmap()函數
matplotlib庫的pyplot模塊中的set_cmap()函數用於設置默認顏色圖,並將其應用於當前圖像(如果有)。
用法: matplotlib.pyplot.set_cmap(cmap)
參數:
- cmap:此參數是顏色圖實例或已注冊顏色圖的名稱。
返回值:此方法不返回任何值。
以下示例說明了matplotlib.pyplot中的matplotlib.pyplot.set_cmap()函數:
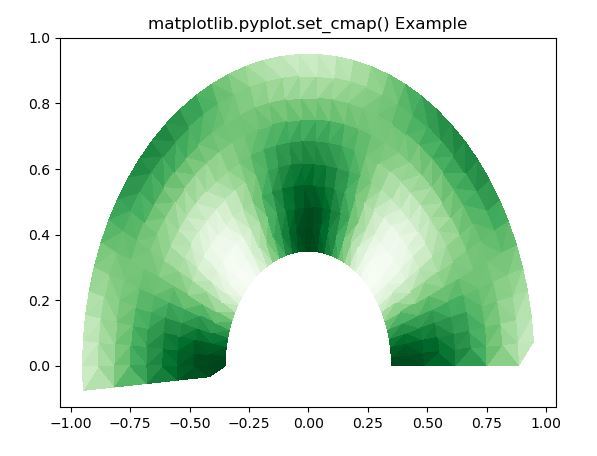
範例1:
# Implementation of matplotlib function
import matplotlib.pyplot as plt
import matplotlib.tri as tri
import numpy as np
ang = 40
rad = 10
radm = 0.35
radii = np.linspace(radm, 0.95, rad)

angles = np.linspace(0, np.pi, ang)
angles = np.repeat(angles[..., np.newaxis],
                   rad, axis = 1)

angles[:, 1::2] += np.pi / ang

x = (radii * np.cos(angles)).flatten()
y = (radii * np.sin(angles)).flatten()
z = (np.sin(4 * radii) * np.cos(4 * angles)).flatten()

triang = tri.Triangulation(x, y)
triang.set_mask(np.hypot(x[triang.triangles].mean(axis = 1),
                         y[triang.triangles].mean(axis = 1))
                < radm)

tpc = plt.tripcolor(triang, z,
                    shading ='flat')
plt.set_cmap("Greens")
plt.title('matplotlib.pyplot.set_cmap() Example')
plt.show()
輸出:

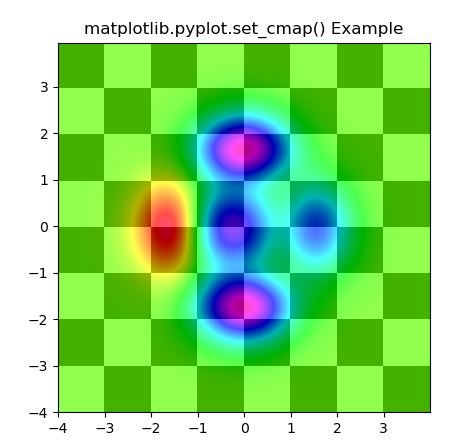
範例2:
# Implementation of matplotlib function
import matplotlib.pyplot as plt
import numpy as np
from matplotlib.colors import LogNorm

dx, dy = 0.015, 0.05
x = np.arange(-4.0, 4.0, dx)
y = np.arange(-4.0, 4.0, dy)
X, Y = np.meshgrid(x, y)

extent = np.min(x), np.max(x), np.min(y), np.max(y)


Z1 = np.add.outer(range(8), range(8)) % 2
plt.imshow(Z1, cmap ="binary_r",
           interpolation ='nearest',
           extent = extent, alpha = 1)

def geeks(x, y):
    return (1 - x / 2 + x**5 + y**6) * np.exp(-(x**2 + y**2))

Z2 = geeks(X, Y)

plt.imshow(Z2, alpha = 0.7,
           interpolation ='bilinear',
           extent = extent)

plt.set_cmap("gist_rainbow")
plt.title('matplotlib.pyplot.set_cmap() Example')
plt.show()
輸出:

注:本文由純淨天空篩選整理自SHUBHAMSINGH10大神的英文原創作品 Matplotlib.pyplot.set_cmap() in Python。非經特殊聲明,原始代碼版權歸原作者所有,本譯文未經允許或授權,請勿轉載或複製。
