Matplotlib是Python中的一個庫,它是數字的-NumPy庫的數學擴展。 Pyplot是Matplotlib模塊的基於狀態的接口,該模塊提供了MATLAB-like接口。在Pyplot中可以使用各種圖,例如線圖,輪廓圖,直方圖,散點圖,3D圖等。
matplotlib.pyplot.sca()方法
matplotlib庫的sca()方法pyplot模塊用於將當前軸設置為a。
用法:matplotlib.pyplot.sca(self, a)
參數:此方法接受下麵討論的以下參數:
- a:該參數是當前軸。
返回值:此方法返回軸。
以下示例說明了matplotlib.figure中的matplotlib.pyplot.sca()函數:
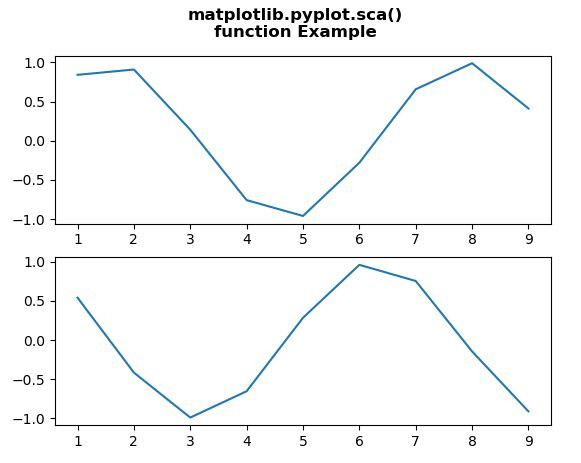
範例1:
# Implementation of matplotlib function
import matplotlib.pyplot as plt
from scipy import sin, cos


fig, ax = plt.subplots(2, 1)
x = [1, 2, 3, 4, 5, 6, 7, 8, 9]

y1 = sin(x)
y2 = cos(x)

plt.sca(ax[0])
plt.plot(x, y1)

plt.sca(ax[1])
plt.plot(x, y2)

fig.suptitle("""matplotlib.pyplot.sca()
function Example\n\n""", fontweight ="bold")

plt.show()
輸出:
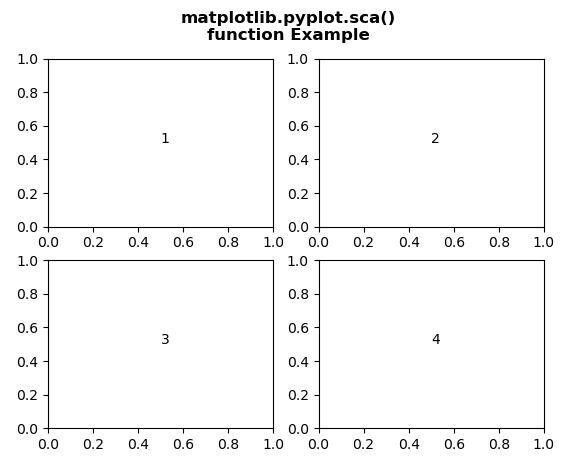
範例2:
# Implementation of matplotlib function
import matplotlib.pyplot as plt


fig, axes = plt.subplots(2, 2)
axes = axes.flatten()

for i in range(4):
    plt.sca(axes[i])
    axes[i].text(0.5, 0.5, i + 1)

fig.suptitle("""matplotlib.pyplot.sca()
function Example\n\n""", fontweight ="bold")

plt.show()
輸出:
相關用法
注:本文由純淨天空篩選整理自SHUBHAMSINGH10大神的英文原創作品 Matplotlib.pyplot.sca() in Python。非經特殊聲明,原始代碼版權歸原作者所有,本譯文未經允許或授權,請勿轉載或複製。