Matplotlib是Python中的一個庫,它是數字的-NumPy庫的數學擴展。 Pyplot是Matplotlib模塊的基於狀態的接口,該模塊提供了MATLAB-like接口。
matplotlib.pyplot.polar()函數:
matplotlib庫的pyplot模塊中的polar()函數用於繪製極坐標圖。
用法: matplotlib.pyplot.polar(*args, **kwargs)
參數:此方法不接受任何參數。
返回:此方法不返回任何值。
以下示例說明了matplotlib.pyplot中的matplotlib.pyplot.polar()函數:
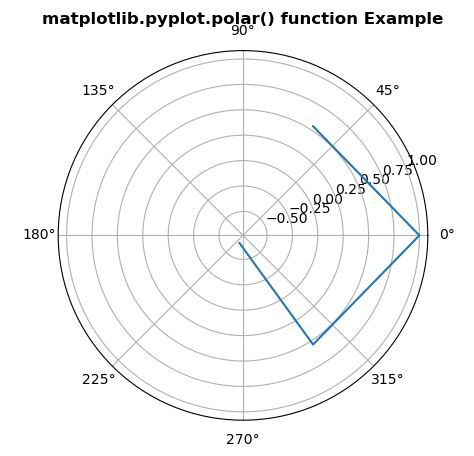
範例1:
# Implementation of matplotlib function
import matplotlib.pyplot as plt
import matplotlib.transforms as mtransforms
import numpy as np

from matplotlib.transforms import offset_copy

xs = np.arange(-2, 2)
ys = np.cos(xs**2)
plt.polar(xs, ys)

plt.title('matplotlib.pyplot.polar() function Example',
                                    fontweight ="bold")
plt.show()
輸出:
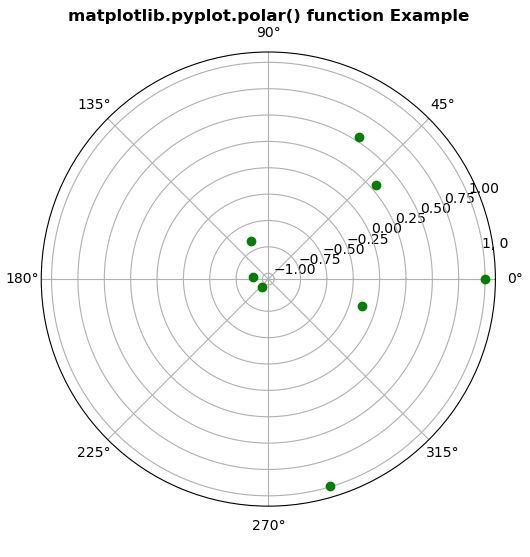
範例2:
# Implementation of matplotlib function
import matplotlib.pyplot as plt
import matplotlib.transforms as mtransforms
import numpy as np

from matplotlib.transforms import offset_copy

xs = np.arange(8)
ys = np.cos(xs**2)

fig = plt.figure(figsize =(5, 10))
ax = plt.subplot(1, 1, 1)

trans_offset = mtransforms.offset_copy(ax.transData, fig = fig,
                                       y = 6, units ='dots')

for x, y in zip(xs, ys):
    plt.polar(x, y, 'go')
    plt.text(x, y, '% d, % d' % (int(x), int(y)),
                       transform = trans_offset,
                  horizontalalignment ='center',
                    verticalalignment ='bottom')

plt.title('matplotlib.pyplot.polar() function Example',
                                    fontweight ="bold")
plt.show()
輸出:
相關用法
注:本文由純淨天空篩選整理自SHUBHAMSINGH10大神的英文原創作品 matplotlib.pyplot.polar() in Python。非經特殊聲明,原始代碼版權歸原作者所有,本譯文未經允許或授權,請勿轉載或複製。