Matplotlib是Python中的一個庫,它是數字的-NumPy庫的數學擴展。 Pyplot是Matplotlib模塊的基於狀態的接口,該模塊提供了MATLAB-like接口。
matplotlib.pyplot.minorticks_on()函數:
matplotlib庫的pyplot模塊中的minorticks_on()函數用於在軸上顯示次刻度。
用法:
matplotlib.pyplot.minorticks_on()
參數:此方法不接受任何參數。
返回值:此方法不返回任何值。
以下示例說明了matplotlib.pyplot中的matplotlib.pyplot.minorticks_on()函數:
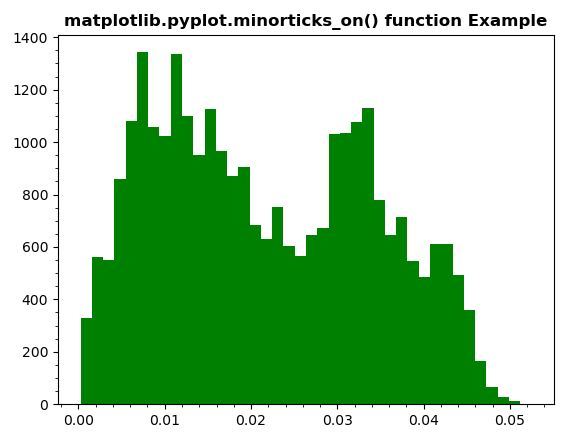
範例1:
# Implementation of matplotlib function
import numpy as np
import matplotlib.pyplot as plt
import matplotlib.cbook as cbook
import matplotlib.cm as cm

from matplotlib.collections import LineCollection
from matplotlib.ticker import MultipleLocator

with cbook.get_sample_data('s1045.ima.gz') as dfile:
    im = np.frombuffer(dfile.read(), np.uint16).reshape((256, 256))

im = np.ravel(im)
im = im[np.nonzero(im)]
im = im / (2**20 - 1)
plt.hist(im, bins = 40, color ="green")

plt.minorticks_on()
plt.title('matplotlib.pyplot.minorticks_on() function Example', fontweight ="bold")
plt.show()
輸出:
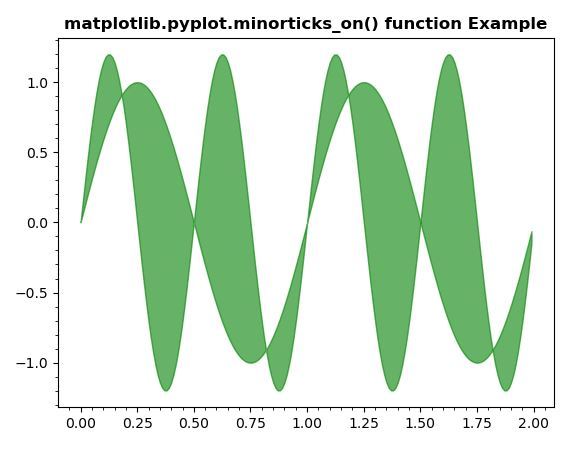
範例2:
# Implementation of matplotlib function
import matplotlib.pyplot as plt
import numpy as np

x = np.arange(0.0, 2, 0.01)
y1 = np.sin(2 * np.pi * x)
y2 = 1.2 * np.sin(4 * np.pi * x)

plt.fill_between(x, y1, y2, color ="green", alpha = 0.6)

plt.minorticks_on()
plt.title('matplotlib.pyplot.minorticks_on() function Example', fontweight ="bold")
plt.show()
輸出:
相關用法
注:本文由純淨天空篩選整理自SHUBHAMSINGH10大神的英文原創作品 matplotlib.pyplot.minorticks_on() in Python。非經特殊聲明,原始代碼版權歸原作者所有,本譯文未經允許或授權,請勿轉載或複製。