Matplotlib是用於數據可視化的最受歡迎的Python軟件包之一。它是一個cross-platform庫,用於根據數組中的數據繪製2D圖.Pyplot是使Matplotlib像MATLAB一樣工作的命令樣式函數的集合。
注意:有關更多信息,請參閱Python Matplotlib-概述
locator_params()用於控製刻度定位器的行為。屬性軸用於指定要在哪個軸上應用函數。
# for Y axis
matplotlib.pyplot.locator_params(axis='y', nbins=3)

# for X axis
matplotlib.pyplot.locator_params(axis='x', nbins=3)

# for both, x-axis and y-axis:Default
matplotlib.pyplot.locator_params(nbins=3)
減少最大刻度數並使用緊邊界:
plt.locator_params(tight=True, nbins=4)
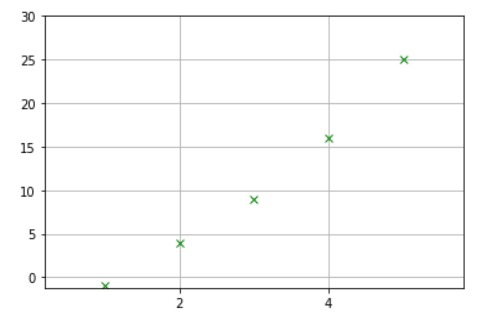
範例1:
# importing libraries
import matplotlib.pyplot as plt

# Y-axis Values
y =[-1, 4, 9, 16, 25]

# X-axis Values
x =[1, 2, 3, 4, 5]

plt.locator_params(axis ='x', nbins = 5)

# adding grid to the plot
axes = plt.axes()
axes.grid()

# defining the plot
plt.plot(x, y, 'mx', color ='green')

# range of y-axis in the plot
plt.ylim(ymin =-1.2, ymax = 30)

# Set the margins
plt.margins(0.2)

# printing the plot
plt.show()
輸出:
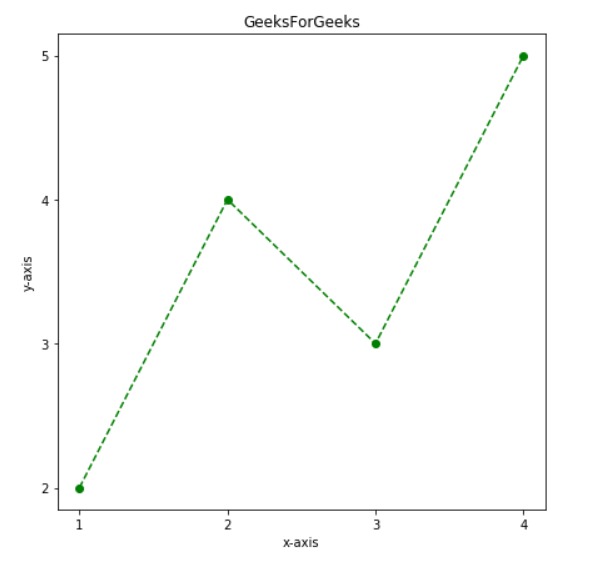
範例2:
# importing libraries
import matplotlib.pyplot as plt

# defining the function
def for_lines(xlab, ylab, plot_title,
              size_x, size_y, content =[]):

  width = len(content[0][1:])
  s = [x for x in range(1, width + 1)]

  # specifying the size of figure
  plt.figure(figsize =(size_x, size_y))

  for line in content:
        plt.plot(s,  line[1:], 'ro--',
                 color ='green',
                 label = line[0])

  # to add title to the plot
  plt.title(plot_title)

  # for adding labels to the plot
  plt.xlabel(xlab)
  plt.ylabel(ylab)

  t = len(s)
  plt.locator_params(nbins = t)

for_lines("x-axis", "y-axis",
          "GeeksForGeeks", 7, 7,
          [[1, 2, 4, 3, 5]])
輸出:
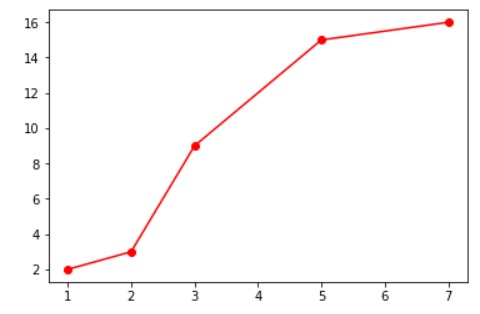
範例3:
# importing libraries
import matplotlib.pyplot as plt

plt.locator_params(nbins = 10)

# defining the plot
plt.plot([1, 2, 3, 5, 7],
         [2, 3, 9, 15, 16],
         'ro-', color ='red')

# printing the plot
plt.show()
輸出:
相關用法
注:本文由純淨天空篩選整理自shardul_singh_tomar大神的英文原創作品 Matplotlib.pyplot.locator_params() in Python。非經特殊聲明,原始代碼版權歸原作者所有,本譯文未經允許或授權,請勿轉載或複製。