Matplotlib是Python中令人驚歎的可視化庫,用於二維陣列圖。 Matplotlib是一個基於NumPy數組構建的multi-platform數據可視化庫,旨在與更廣泛的SciPy堆棧配合使用。可視化的最大好處之一是,它使我們能夠以易於消化的視覺效果直觀地訪問大量數據。 Matplotlib由幾個圖組成,例如線條,條形圖,散點圖,直方圖等。
matplotlib.pyplot.ion()用於打開交互模式。要檢查交互模式的狀態,可以運行以下命令,
plt.rcParams['interactive']
或者,此命令
plt.isinteractive()
Matplotlib還與後台的不同後端進行交互。在matplotlib中渲染圖表的主要動力是其後端。每次更改後,一些交互式後端都會動態更新並彈出給用戶。默認情況下,交互模式是關閉的。
用法:
matplotlib.pyplot.ion()
它不接受任何參數。
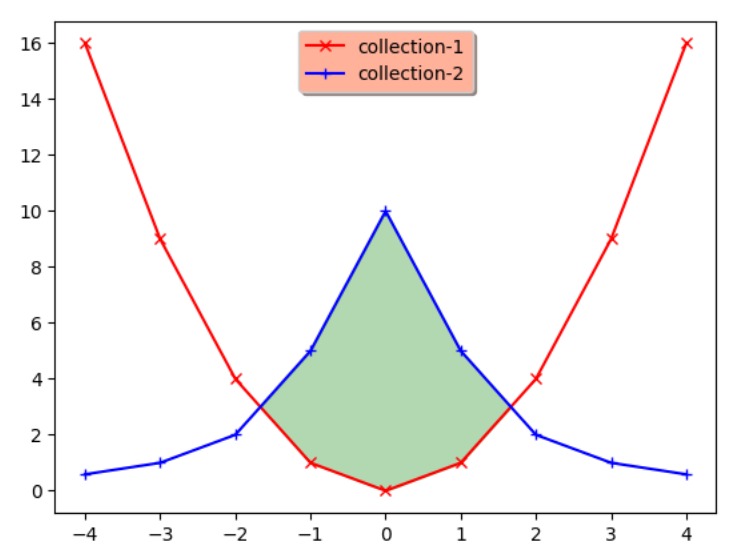
範例1:
import matplotlib.pyplot as plt

#the function to turn on interactive mode
plt.ion()

#creating randomly generate collections/data
random_array = np.arange(-4, 5)
collection_1 = random_array ** 2
collection_2 = 10 / (random_array ** 2 + 1)
figure, axes = plt.subplots()

axes.plot(random_array, collection_1,
          'rx', random_array,
          collection_2, 'b+',
          linestyle='solid')

axes.fill_between(random_array,
                  collection_1,
                  collection_2,
                  where=collection_2>collection_1,
                  interpolate=True,
                  color='green', alpha=0.3)

lgnd = axes.legend(['collection-1',
                    'collection-2'],
                   loc='upper center',
                   shadow=True)

lgnd.get_frame().set_facecolor('#ffb19a')
輸出:

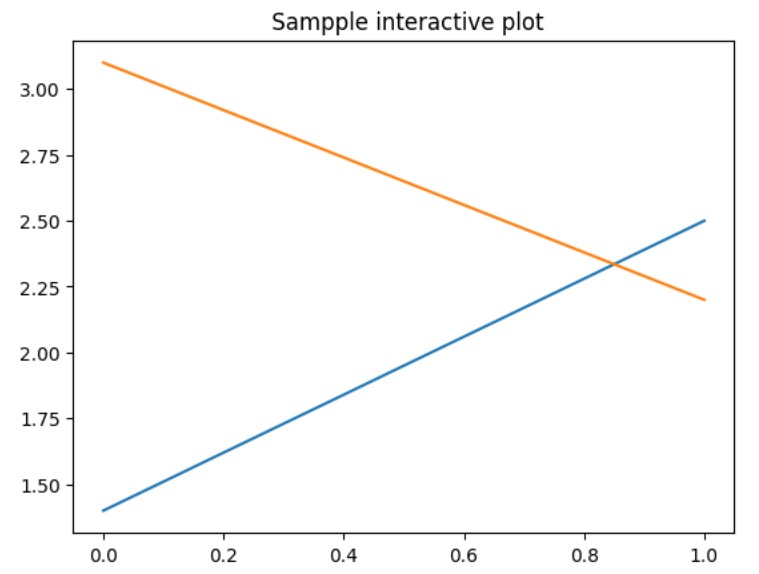
範例2:
import matplotlib.pyplot as plt

plt.ion()
plt.plot([1.4, 2.5])
plt.title(" Sampple interactive plot")

axes = plt.gca()
axes.plot([3.1, 2.2])
輸出:

相關用法
注:本文由純淨天空篩選整理自RajuKumar19大神的英文原創作品 Matplotlib.pyplot.ion() in Python。非經特殊聲明,原始代碼版權歸原作者所有,本譯文未經允許或授權,請勿轉載或複製。
