Matplotlib是Python中的一個庫,它是數字的-NumPy庫的數學擴展。 Pyplot是Matplotlib模塊的基於狀態的接口,該模塊提供了MATLAB-like接口。
matplotlib.pyplot.grid()函數
matplotlib庫的pyplot模塊中的grid()函數用於配置網格線。
用法: matplotlib.pyplot.grid(b=None, which=’major’, axis=’both’, \*\*kwargs)
參數:此方法接受以下參數。
- b:此參數是可選參數,是否顯示網格線。
- which:此參數也是可選參數,是應用更改的網格線。
- axis:此參數也是可選參數,它是應用更改的軸。
返回值:此方法不返回任何值。
以下示例說明了matplotlib.pyplot中的matplotlib.pyplot.grid()函數:
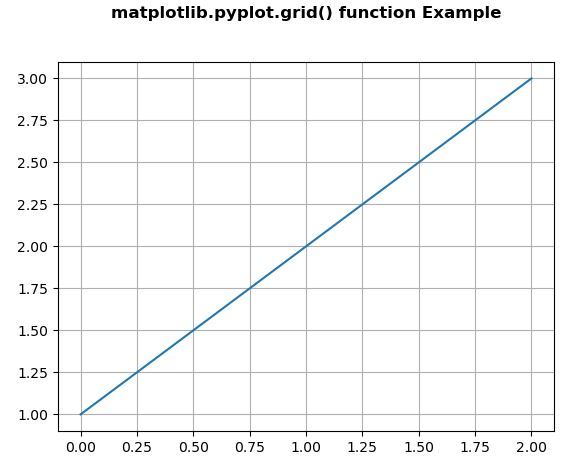
範例1:
# Implementation of matplotlib function
import matplotlib.pyplot as plt
import numpy as np

plt.plot([1, 2, 3])
plt.grid()

plt.title('matplotlib.pyplot.grid() function \
Example\n\n', fontweight ="bold")
plt.show()
輸出:
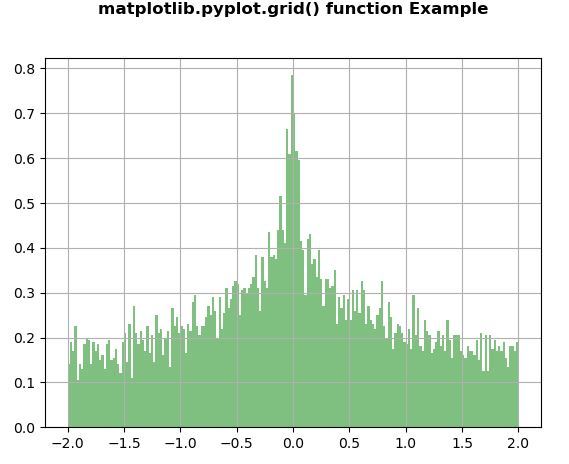
範例2:
# Implementation of matplotlib function
import numpy as np
import matplotlib.pyplot as plt

np.random.seed(19680801)

val, res = 100, 15
x = np.sin(val + res * np.random.randn(10000)) - np.cos(val + res * np.random.randn(10000))

n, bins, patches = plt.hist(x, 200,
                            density = True,
                            facecolor ='g',
                            alpha = 0.5)

plt.grid(True)

plt.title('matplotlib.pyplot.grid() function \
Example\n\n', fontweight ="bold")

plt.show()
輸出:
相關用法
注:本文由純淨天空篩選整理自SHUBHAMSINGH10大神的英文原創作品 Matplotlib.pyplot.grid() in Python。非經特殊聲明,原始代碼版權歸原作者所有,本譯文未經允許或授權,請勿轉載或複製。