Matplotlib是Python中的一個庫,它是數字的-NumPy庫的數學擴展。 Pyplot是Matplotlib模塊的基於狀態的接口,該模塊提供了MATLAB-like接口。在Pyplot中可以使用各種圖,例如線圖,輪廓圖,直方圖,散點圖,3D圖等。
matplotlib.pyplot.table()函數
matplotlib庫的ginput()方法pyplot模塊用於阻止與圖進行交互的調用。
用法: matplotlib.pyplot.ginput(n=1, timeout=30, show_clicks=True, mouse_add=1, mouse_pop=3, mouse_stop=2)
參數:此方法接受以下描述的參數:
- n:此參數是要累積的鼠標單擊次數。
- timeout:此參數是超時之前要等待的秒數。
- show_clicks:此參數用於在每次單擊的位置顯示一個紅叉。
- mouse_add:此參數是用於添加點的鼠標按鈕。
- mouse_pop:此參數是鼠標按鈕,用於刪除最近添加的點。
- mouse_stop:此參數是用於停止輸入的鼠標按鈕。
返回值:此方法返回單擊的(x,y)坐標的列表。
以下示例說明了matplotlib.pyplot中的matplotlib.pyplot.ginput()函數:
範例1:
# Implementation of matplotlib function
import matplotlib.pyplot as plt
import numpy as np
t = np.arange(10)


plt.plot(t, np.sin(t))

plt.title('matplotlib.pyplot.ginput()\
 function Example', fontweight ="bold")

print("After 3 clicks:")
x = plt.ginput(3)
print(x)

plt.show()
輸出:
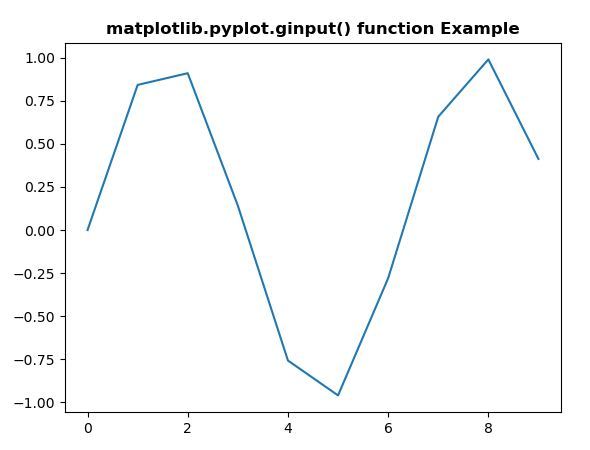
After 3 clicks:
[(4.460080645161289, 0.5915838985273842),
(4.460080645161289, 0.5915838985273842),
(4.460080645161289, 0.5915838985273842)]
範例2:
# Implementation of matplotlib function
import matplotlib.pyplot as plt
import numpy as np


np.random.seed(10**7)

x1 = np.random.rand(103, 53)

plt.title('matplotlib.pyplot.ginput() function\
 Example', fontweight ="bold")

print("After 2 clicks:")
plt.imshow(x1)
x = plt.ginput(2)
print(x)

plt.show()
輸出:
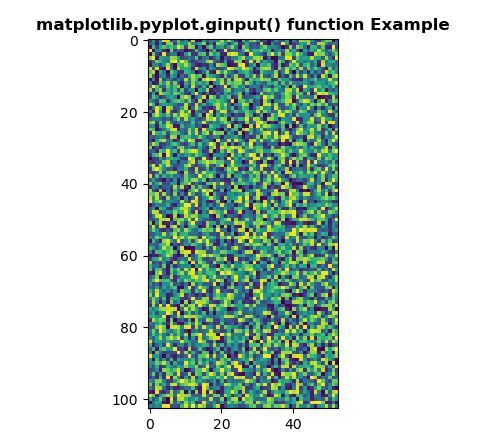
After 2 clicks:
[(8.443181818181813, 38.90530303030302),
(8.443181818181813, 38.90530303030302)]
相關用法
注:本文由純淨天空篩選整理自SHUBHAMSINGH10大神的英文原創作品 Matplotlib.pyplot.ginput() in Python。非經特殊聲明,原始代碼版權歸原作者所有,本譯文未經允許或授權,請勿轉載或複製。