Matplotlib.pyplot.fill()函數用於填充多邊形/曲線所包圍的區域。
用法: matplotlib.pyplot.fill(*args, data=None, **kwargs)
參數:
*參數:x,y,[顏色]的順序
x,y的順序=遍曆由其節點的x和y位置列表定義的多邊形或曲線的邊界color =將默認填充顏色更改為所需的填充顏色。您可以通過提供多個x來繪製多個多邊形, y,[顏色]組。
data:可索引對象,可選
默認值=無
您可以直接以字典的形式提供帶標簽的數據。為了更好的理解,請參考Example2
返回:多邊形列表
Other Parameters:
**kwargs:支持Polygon修補程序的所有其他屬性。
範例1:
Python3
# Importing the library
import matplotlib
import matplotlib.pyplot as plt
import numpy as np

# Data for plotting
x = np.arange(0.0, 2.0, 0.01)
y = 1 + np.sin(2 * np.pi * x)
plt.plot(x, y)

# Assighning plot attributes
plt.xlabel("angle")
plt.ylabel("sine")
plt.title('sine wave')

# Filling sign wave curv with cyan color
plt.fill(x, y, "c")
plt.show()
輸出:
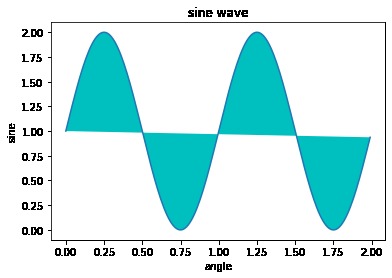
示例1_Output_GFG
範例2:
Python3
# Importing libraries
import matplotlib
import matplotlib.pyplot as plt


# Below we are using data attribute
plt.fill("j", "k", 'm',
         data={"j":[0, 1, 2],
               "k":[0, 1, 0]})  # here 'm' for magenta
輸出:
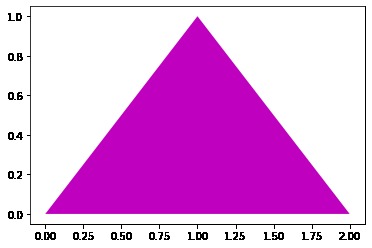
示例2_Output_GFG
相關用法
- Python Wand function()用法及代碼示例
- Python Sorted()用法及代碼示例
- Python Numbers choice()用法及代碼示例
- Python Tkinter askopenfile()用法及代碼示例
- Python ord()用法及代碼示例
- Python round()用法及代碼示例
- Python id()用法及代碼示例
- Python vars()用法及代碼示例
注:本文由純淨天空篩選整理自tejalkadam18m大神的英文原創作品 Matplotlib.pyplot.fill() function in Python。非經特殊聲明,原始代碼版權歸原作者所有,本譯文未經允許或授權,請勿轉載或複製。