Matplotlib是Python中的一個庫,它是數字的-NumPy庫的數學擴展。 Pyplot是Matplotlib模塊的基於狀態的接口,該模塊提供了MATLAB-like接口。在Pyplot中可以使用各種圖,例如線圖,輪廓圖,直方圖,散點圖,3D圖等。
matplotlib.pyplot.figure()函數:
matplotlib庫的pyplot模塊中的figure()函數用於創建新圖形。
用法: matplotlib.pyplot.figure(num=None, figsize=None, dpi=None, facecolor=None, edgecolor=None, frameon=True, FigureClass=, clear=False, **kwargs)
參數:此方法接受以下描述的參數:
- num:提供了此參數,並且具有該ID的圖形已經存在。
- figsize(float, float):這些參數是寬度,高度(以英寸為單位)。
- dpi:此參數是圖形的分辨率。
- facecolor:此參數是背景色。
- edgecolor:此參數是邊框顏色。
- frameon:此參數禁止繪製圖形框。
- FigureClass:此參數使用自定義Figure實例。
- clear:如果此參數為True並且圖形已經存在,則將其清除。
返回值:此方法返回以下值:
- figure:這將返回返回的Figure實例,該實例還將在後端傳遞給new_figure_manager。
以下示例說明了matplotlib.axes中的matplotlib.pyplot.figure()函數:
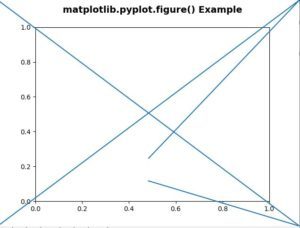
範例1:
# Implementation of matplotlib function
import matplotlib.pyplot as plt
import matplotlib.lines as lines


fig = plt.figure()
fig.add_artist(lines.Line2D([0, 1, 0.5], [0, 1, 0.3]))
fig.add_artist(lines.Line2D([0, 1, 0.5], [1, 0, 0.2]))

plt.title('matplotlib.pyplot.figure() Example\n',
                fontsize = 14, fontweight ='bold')

plt.show()
輸出:
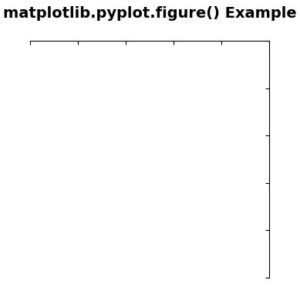
範例2:
# Implementation of matplotlib function
import matplotlib.pyplot as plt
from mpl_toolkits.axisartist.axislines import Subplot

fig = plt.figure(figsize =(4, 4))

ax = Subplot(fig, 111)
fig.add_subplot(ax)

ax.axis["left"].set_visible(False)
ax.axis["bottom"].set_visible(False)

plt.title('matplotlib.pyplot.figure() Example\n',
                fontsize = 14, fontweight ='bold')

plt.show()
輸出:
相關用法
注:本文由純淨天空篩選整理自SHUBHAMSINGH10大神的英文原創作品 matplotlib.pyplot.figure() in Python。非經特殊聲明,原始代碼版權歸原作者所有,本譯文未經允許或授權,請勿轉載或複製。