Matplotlib是一個廣泛使用的Python庫,用於數據可視化。它是建立在NumPy陣列上的多平台數據可視化庫,也旨在與SciPy堆棧配合使用。
Matplotlib.pyplot.figtext()
Figtext用於在圖上的任何位置向圖添加文本。您甚至可以在軸外添加文本。它使用完整的圖形作為坐標,其中左下角表示(0,0),右上角表示(1,1)。圖的中心是(0.5,0.5)。
用法:
matplotlib.pyplot.figtext(x, y, s, *args, **kwargs)
| 參數 | 值 | 使用 |
|---|---|---|
| x, y | Float | 放置文本的位置。默認情況下,它在圖形坐標[0,1]中 |
| s | String | 文字字串 |
範例1:一個示例示例,演示了使用figtext的過程。
# importing required modules
import matplotlib.pyplot as plt
import numpy as np

# values of x and y axes
x = np.arange(0, 8, 0.1)
y = np.sin(x)
plt.plot(x, y)

# pyplot.figtext(x, y, string)
plt.figtext(0, 0, "This is a sample example \
explaining figtext", fontsize = 10)

plt.xlabel('x')
plt.ylabel('y')
plt.show()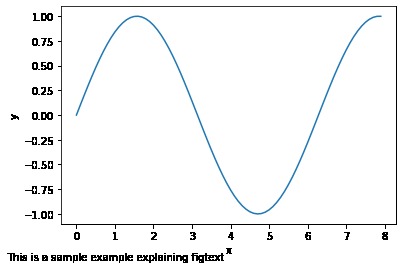
上麵的示例將文本放在給定字體大小的圖形的左下方。
範例2:我們還可以通過調整x和y的值將文本放置在圖中的相對位置。
# importing required modules
import matplotlib.pyplot as plt
import numpy as np

# values of x and y axes
x = np.arange(0, 8, 0.1)
y = np.sin(x)
plt.plot(x, y)

plt.figtext(0.55, 0.7,
            "Sin curve",
            horizontalalignment ="center",
            verticalalignment ="center",
            wrap = True, fontsize = 14,
            color ="green")

plt.xlabel('x')
plt.ylabel('y')
plt.show()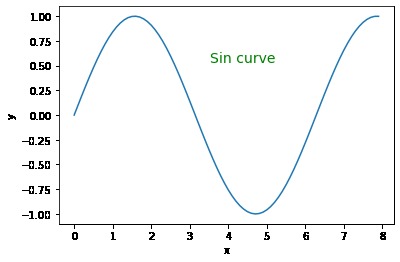
對齊參數-水平對齊和垂直對齊將文本放置在中間,而換行參數可確保文本位於圖形寬度內。 color參數提供字體顏色。
範例3:我們還可以使用bbox參數在文本周圍添加邊框。
# importing required modules
import matplotlib.pyplot as plt
import numpy as np

# values of x and y axes
x = np.arange(0, 8, 0.1)
y = np.exp(x)
plt.plot(x, y)

# pyplot.figtext(x, y, string)
plt.figtext(0.55, 0.7,
            "Exponential Curve",
            horizontalalignment ="center",
            wrap = True, fontsize = 10,
            bbox ={'facecolor':'grey',
                   'alpha':0.3, 'pad':5})

plt.xlabel('x')
plt.ylabel('y')
plt.show()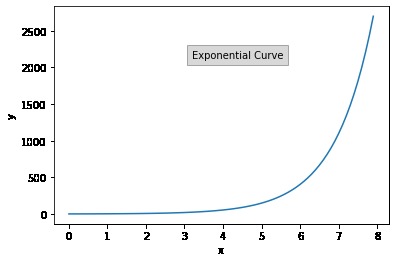
範例4:我們還可以使用* args和** kwargs將文本屬性添加到繪圖中。 * args和** kwargs用於將多個參數或關鍵字參數傳遞給函數。
注意:有關更多信息,請參閱文章:Python中的* args和** kwargs
# importing required properties
import numpy as np
import matplotlib.pyplot as plt

x = np.linspace(0, 100, 501)
y = np.sin(x)

figtext_args = (0.5, 0,
                "figtext using args and kwargs")

figtext_kwargs = dict(horizontalalignment ="center",
                      fontsize = 14, color ="green",
                      style ="italic", wrap = True)

plt.plot(x, y)
plt.figtext(*figtext_args, **figtext_kwargs)
plt.show()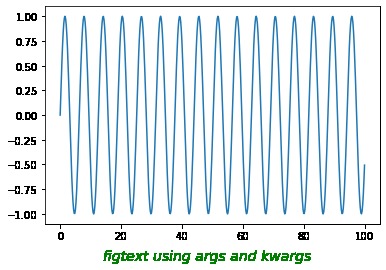
相關用法
注:本文由純淨天空篩選整理自Hritika Rajput大神的英文原創作品 Matplotlib.pyplot.figtext() in Python。非經特殊聲明,原始代碼版權歸原作者所有,本譯文未經允許或授權,請勿轉載或複製。