Matplotlib是Python中的一個庫,它是數字的-NumPy庫的數學擴展。 Pyplot是Matplotlib模塊的基於狀態的接口,該模塊提供了MATLAB-like接口。可在Pyplot中使用的各種圖線圖,輪廓圖,直方圖,散點圖,3D圖等。
matplotlib.pyplot.fignum_exists()方法
matplotlib庫的pyplot模塊中的fignum_exists()方法用於獲取是否存在具有給定id的圖形。
用法:matplotlib.pyplot.fignum_exists(num)
參數:
num:此參數是圖形編號。
返回:此方法返回是否存在具有給定id的圖形。
以下示例說明了matplotlib.pyplot中的matplotlib.pyplot.fignum_exists()函數:
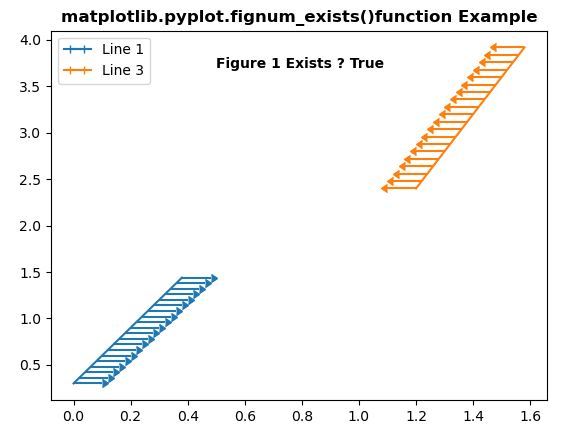
範例1:
#Implementation of matplotlib function
import matplotlib.pyplot as plt
import numpy as np


x = np.arange(20) / 50
y = (x + 0.1)*3

val1 = [True, False] * 10
val2 = [False, True] * 10

plt.errorbar(x, y,
             xerr=0.1,
             xlolims=True,
             label='Line 1')

y = (x + 0.3)*3

y = (x + 0.6)*4

plt.errorbar(x + 1.2,
             y,
             xerr=0.1,
             xuplims=True,
             label='Line 3')

plt.legend()

plt.text(0.5, 3.7,
         "Figure 1 Exists ? " +
         str(plt.fignum_exists(1)) ,
         fontweight="bold")

plt.title('matplotlib.pyplot.fignum_exists()function\
Example' ,fontweight="bold")

plt.show()
輸出:
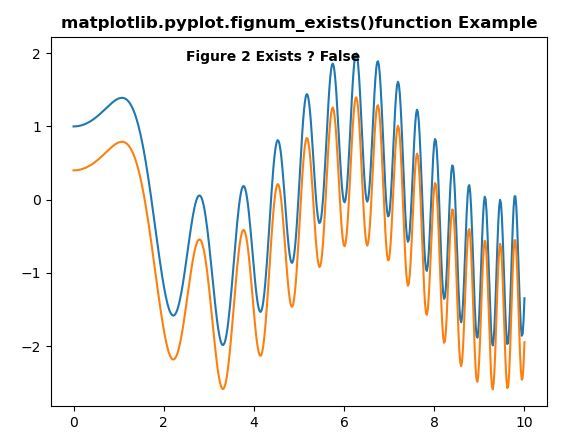
範例2:
# Implementation of matplotlib function
import numpy as np
import matplotlib.pyplot as plt


x = np.linspace(0, 10, 500)
y = np.sin(x**2)+np.cos(x)

plt.plot(x, y, label ='Line 1')
plt.plot(x, y - 0.6, label ='Line 2')

plt.text(2.5, 1.9,
         "Figure 2 Exists ? " +
         str(plt.fignum_exists(2)),
         fontweight ="bold")

plt.title('matplotlib.pyplot.fignum_exists()function\
 Example', fontweight ="bold")

plt.show()
輸出:
注:本文由純淨天空篩選整理自SHUBHAMSINGH10大神的英文原創作品 Matplotlib.pyplot.fignum_exists() in Python。非經特殊聲明,原始代碼版權歸原作者所有,本譯文未經允許或授權,請勿轉載或複製。