Matplotlib是Python中令人驚歎的可視化庫,用於二維陣列圖。 Matplotlib是一個基於NumPy數組構建的multi-platform數據可視化庫,旨在與更廣泛的SciPy堆棧配合使用。
Matplotlib.pyplot.eventplot()
此函數通常用於在給定位置繪製相同的線。這些圖通常用於表示神經科學中的神經事件,在更多情況下,它被稱為尖峰柵格或點柵格或柵格圖。通常,它還用於顯示多組不同或離散事件的計時或位置。例如,在過去的十年或世紀中,員工每天上班的時間是每個月到公司的時間,或者每年颶風的日期是。
Syntax:: matplotlib.pyplot.eventplot(positions, orientation=’vertical’, lineoffsets=2, linelengths=2, linewidth= None, colors= None, linestyles=’solid’, *, data= None, **kwargs)
參數:
- Positions: This parameter is generally a 1D or D array-like object where each value in the array represents an event. For a 2D array like position, each row corresponds to either a row or a column of the line which depends upon the orientation parameter. It is a required parameter for this method.
- orientation: It is an optional argument which takes two values either ‘horizontal’ or ‘vertical’. It is responsible for controlling the direction of the event collections. If the passed value of orientation is ‘horizontal’ the lines are arranged horizontally in rows and are vertical whereas if the passed value is ‘vertical’ the lines are arranged vertically in columns and are horizontal
- lineoffsets: This is an optional argument whose default value is 1. This parameter is used for plotting offset of the center of lines starting from the origin, which are orthogonal to the orientation of the plot. It accepts a scalar or sequence of scalars as its values.
- linelengths: Similar to lineoffsets it is also an optional parameter whose default value is 1 and accepts scalar or a scalar sequence as its value. It is used to set the total height of the lines. It sets the stretches of the lines from lineoffset - linelength/2 to lineoffset + linelength/2.
- linewidths: It is an optional parameter whose default value is None. It accepts scalar or scalar sequence or None as values. It is used to set the line width(s) of event lines in points. If it is set to None it defaults to its rcParams setting.
- colors: As the name suggests it is used to set the colors of the event lines. It is an optional parameter whose default value is None. If the value is None it defaults to its rcParams setting. It takes color, the sequence of colors or None as a value.
- linestyles: It is an optional parameter that takes a string, tuple or a sequence of strings or tuples as its value. The default value for this parameter is ‘solid’. The valid strings for this parameter are [‘solid’, ‘dashed’, ‘dashdot’, ‘dotted’, ‘-‘, ‘-‘, ‘-.’, ‘:’]. The dash tuples need to be in the form of (offset, onoffseq) where onoffseq is a tuple of on and off ink in points of even lengths.
- **kwargs: It is an optional parameter. It generally accepts keywords from LineCollection properties.
返回:
This method returns a list of EventCollection objects which contains the EventCollection that were added.
注意:重要的是要注意,對於線長,線寬,顏色和線型,如果僅提供一個值,而不是將這些值應用於所有行,則對於array-like值,重要的是它與位置和每個值的長度相同應用於數組的相應行。
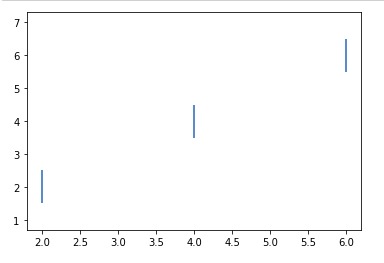
範例1:
import numpy as np
import matplotlib.pyplot as plt

positions = np.array([2, 4, 6])[:,np.newaxis]
offsets = [2,4,6]

plt.eventplot(positions, lineoffsets=offsets)
plt.show()
輸出:
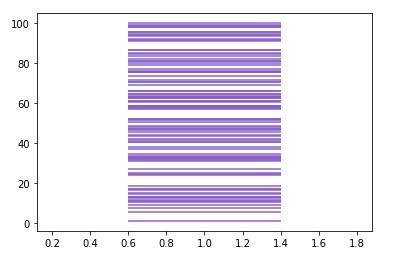
範例2:
import numpy as np
import matplotlib.pyplot as plt

spike = 100*np.random.random(100)
plt.eventplot(spike,
              orientation = 'vertical',
              linelengths = 0.8,
              color = [(0.5,0.5,0.8)])
輸出:
相關用法
注:本文由純淨天空篩選整理自RajuKumar19大神的英文原創作品 Matplotlib.pyplot.eventplot() in Python。非經特殊聲明,原始代碼版權歸原作者所有,本譯文未經允許或授權,請勿轉載或複製。