Matplotlib是Python中的一個庫,它是數字的-NumPy庫的數學擴展。 Pyplot是Matplotlib模塊的基於狀態的接口,該模塊提供了MATLAB-like接口。
matplotlib.pyplot.contour()函數
matplotlib庫的pyplot模塊中的contour()函數用於繪製輪廓。
用法: matplotlib.pyplot.contour(\*args, data=None, \*\*kwargs)
參數:此方法接受以下描述的參數:
- X, Y:這些參數是Z值的坐標。
- Z:該參數是繪製輪廓的高度值。
- levels:該參數用於確定輪廓線/區域的數量和位置。
返回值:這將返回以下內容:
- c:這將返回
QuadContourSet。
以下示例說明了matplotlib.pyplot中的matplotlib.pyplot.contour()函數:
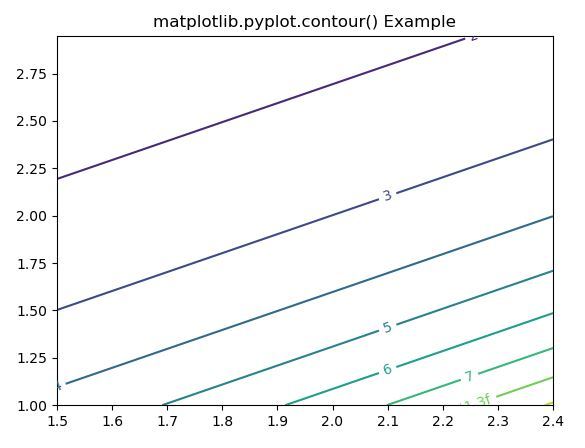
範例1:
# Implementation of matplotlib function
import numpy as np
import matplotlib.pyplot as plt
import matplotlib.ticker as ticker
import matplotlib

delta = 0.15
x = np.arange(1.5, 2.5, delta)
y = np.arange(1.0, 3.0, delta)
X, Y = np.meshgrid(x, y)
Z = (np.exp(X - Y))


CS1 = plt.contour(X, Y, Z)

fmt = {}
strs = ['1', '2', '3', '4', '5', '6', '7']
for l, s in zip(CS1.levels, strs):
    fmt[l] = s
plt.clabel(CS1, CS1.levels, inline = True,
           fmt = fmt, fontsize = 10)

plt.title('matplotlib.pyplot.contour() Example')
plt.show()
輸出:
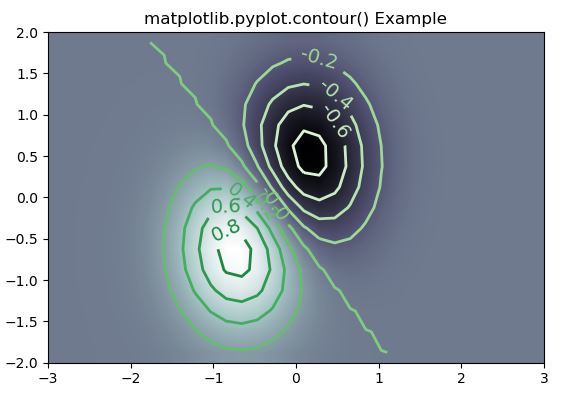
範例2:
# Implementation of matplotlib function
import matplotlib
import numpy as np
import matplotlib.cm as cm
import matplotlib.pyplot as plt

delta = 0.25
x = np.arange(-3.0, 5.0, delta)
y = np.arange(-1.3, 2.5, delta)
X, Y = np.meshgrid(x, y)
Z = (np.exp(-X**2 - Y**2) - np.exp(-(X - 1)**2 - (Y - 1)**2))

fig, ax = plt.subplots()
im = ax.imshow(Z, interpolation ='bilinear',
               origin ='lower',
               cmap ="bone",
               extent =(-3, 3, -2, 2))

levels = np.arange(-1.2, 1.6, 0.2)
CS = ax.contour(Z, levels,
                origin ='lower',
                cmap ='Greens',
                linewidths = 2,
                extent =(-3, 3, -2, 2))

zc = CS.collections[6]
plt.setp(zc, linewidth = 2)

ax.clabel(CS, levels,
          inline = 1,
          fmt ='% 1.1f',
          fontsize = 14)

plt.title('matplotlib.pyplot.contour() Example')
plt.show()
輸出:
相關用法
注:本文由純淨天空篩選整理自SHUBHAMSINGH10大神的英文原創作品 Matplotlib.pyplot.contour() in Python。非經特殊聲明,原始代碼版權歸原作者所有,本譯文未經允許或授權,請勿轉載或複製。