Matplotlib是Python中的一個庫,它是數字的-NumPy庫的數學擴展。 Pyplot是Matplotlib模塊的基於狀態的接口,該模塊提供了MATLAB-like接口。
matplotlib.pyplot.connect()函數
此方法用於將帶有字符串s的事件連接到函數。
用法: matplotlib.pyplot.connect(s, func)
參數:此方法接受以下描述的參數:
s(str):以下事件ID之一:
1.‘button_press_event’
2.‘button_release_event’
3.‘draw_event’
4.‘key_press_event’
5.‘key_release_event’
6.‘motion_notify_event’
7.‘pick_event’
8.‘resize_event’
9.‘scroll_event’
10.“ figure_enter_event”,
11.“ figure_leave_event”,
12.“ axes_enter_event”,
13.‘axes_leave_event’
14.“ close_event”。
func(callable):要執行的回調函數,必須具有簽名:
def func(event:Event)->任何
Returns(cid):可以與FigureCanvasBase.mpl_disconnect一起使用的連接ID。
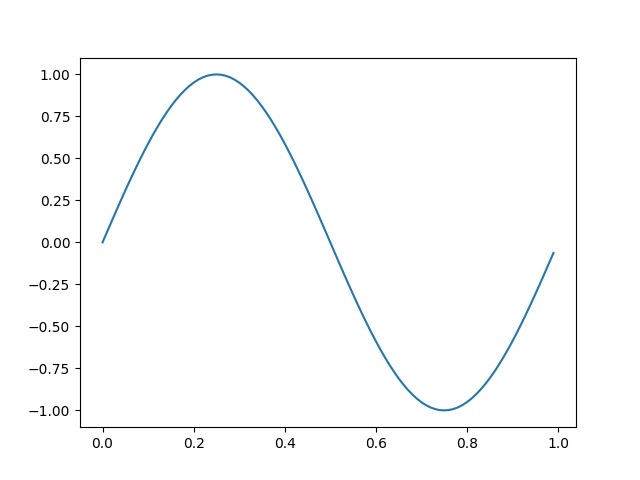
範例1:
# matplotlib.pyplot.connect()
from matplotlib.backend_bases import MouseButton
import matplotlib.pyplot as plt
import numpy as np
t = np.arange(0.0, 1.0, 0.01)
s = np.sin(2 * np.pi * t)
fig, ax = plt.subplots()
ax.plot(t, s)
def on_move(event):
# get the x and y pixel coords
x, y = event.x, event.y
if event.inaxes:
ax = event.inaxes # the axes instance
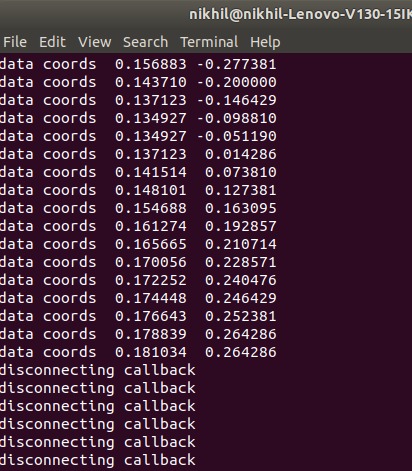
print('data coords % f % f' % (event.xdata,
event.ydata))
def on_click(event):
if event.button is MouseButton.LEFT:
print('disconnecting callback')
plt.disconnect(binding_id)
binding_id = plt.connect('motion_notify_event',
on_move)
plt.connect('button_press_event', on_click)
plt.show()輸出:
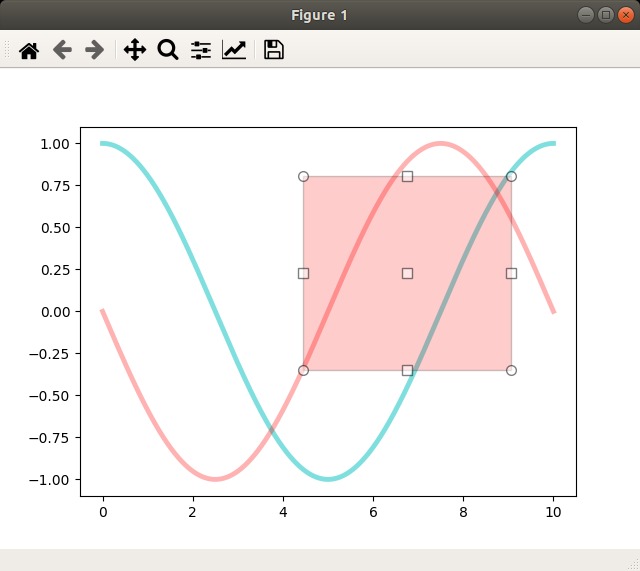
範例2:
from matplotlib.widgets import RectangleSelector
import numpy as np
import matplotlib.pyplot as plt
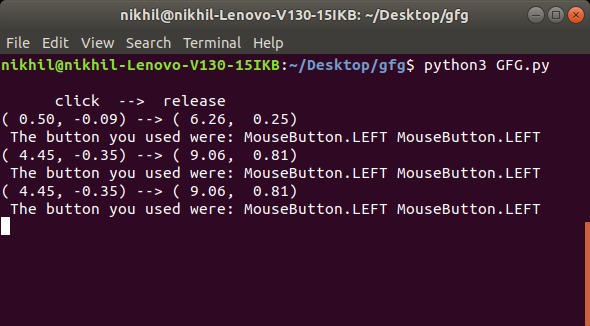
def line_select_callback(eclick, erelease):
# Callback for line selection.
# *eclick * and * erelease *
# are the press and release events.
x1, y1 = eclick.xdata, eclick.ydata
x2, y2 = erelease.xdata, erelease.ydata
print("(% 3.2f, % 3.2f) --> (% 3.2f, % 3.2f)" % (x1, y1, x2, y2))
print(" The button you used were:% s % s" % (eclick.button,
erelease.button))
def toggle_selector(event):
print(' Key pressed.')
if event.key in ['Q', 'q'] and toggle_selector.RS.active:
print(' RectangleSelector deactivated.')
toggle_selector.RS.set_active(False)
print(' RectangleSelector activated.')
toggle_selector.RS.set_active(True)
# make a new plotting range
fig, current_ax = plt.subplots()
# If N is large one can see
N = 100000
# improvement by use blitting !
# plt.plot(x, +np.sin(.2 * np.pi * x),
# lw = 3.5, c ='b', alpha =.7)
# plot something
x = np.linspace(0.0, 10.0, N)
plt.plot(x, +np.cos(.2 * np.pi * x),
lw = 3.5, c ='c', alpha =.5)
plt.plot(x, -np.sin(.2 * np.pi * x),
lw = 3.5, c ='r', alpha =.3)
print("\n click --> release")
# drawtype is 'box' or 'line' or 'none'
toggle_selector.RS = RectangleSelector(current_ax, line_select_callback,
drawtype ='box',
useblit = True,
button =[1, 3], # don't use middle button
minspanx = 5, minspany = 5,
spancoords ='pixels',
interactive = True)
plt.connect('key_press_event', toggle_selector)
plt.show()輸出:
相關用法
注:本文由純淨天空篩選整理自dhruv_tewari大神的英文原創作品 Matplotlib.pyplot.connect() in Python。非經特殊聲明,原始代碼版權歸原作者所有,本譯文未經允許或授權,請勿轉載或複製。