Matplotlib是一個繪圖庫,用於在Python中創建靜態,動畫和交互式可視化。 Matplotlib可以在Python腳本,Python和IPython Shell,Web應用程序服務器以及各種圖形用戶接口工具包(例如Tkinter,awxPython等)中使用。
注意:有關更多信息,請參閱Python Matplotlib-概述
Pyplot是Matplotlib模塊,提供MATLAB-like接口。 Matplotlib設計為與MATLAB一樣可用,具有使用Python的能力以及免費和開源的優勢。
注意:有關更多信息,請參閱Matplotlib中的Pyplot。
matplotlib.pyplot.axvline()
此函數在繪圖軸上添加垂直線
用法:

matplotlib.pyplot.axvline(x=0, ymin=0, ymax=1, **kwargs)
參數:
x:數據坐標中的x位置以放置垂直線
ymin:y軸上的垂直線起始位置,它將取0到1之間的值,0是軸的底部,1是軸的頂部
ymax:y軸上的垂直線結束位置,它將取0到1之間的值,0是軸的底部,1是軸的頂部
**kwargs:其他可選參數可更改線的屬性,例如
改變顏色,線寬等
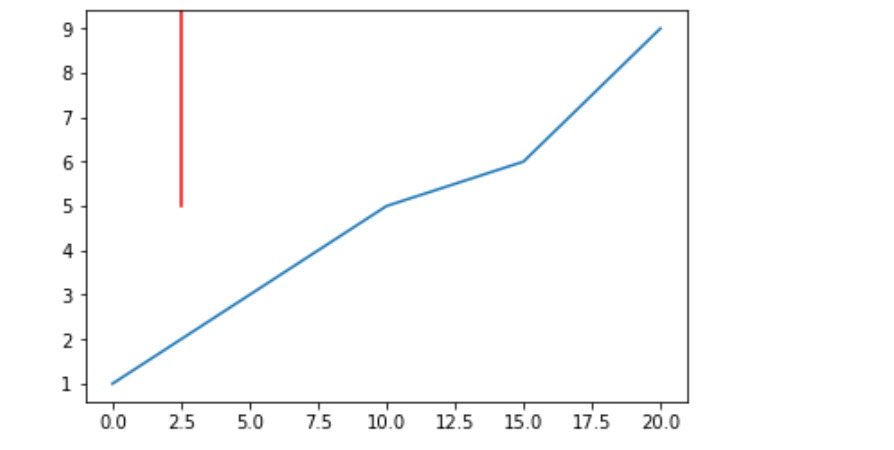
示例1:
# Importing matplotlib.pyplot as plt
import matplotlib.pyplot as plt


# Initialising values of x and y
x =[0, 5, 10, 15, 20]
y =[1, 3, 5, 6, 9]

# Plotting the graph
plt.plot(x, y)

# Drawing red vertical line at
# x = 2.5 starting at half the
#length of y axis(ymin = 0.5) and
#continuing till the end(ymax = 1)
# And setting the color of line to red
plt.axvline(x = 2.5, ymin = 0.5, ymax = 1,
            color ='red')

plt.show()
輸出:
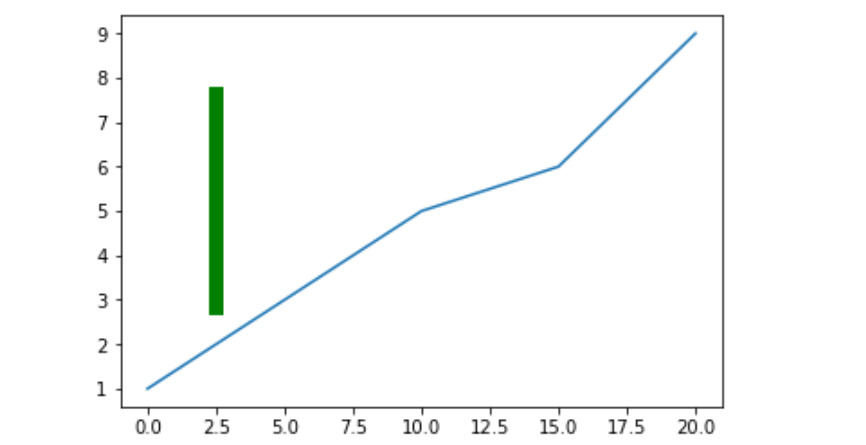
示例-2:
import matplotlib.pyplot as plt

x =[0, 5, 10, 15, 20]
y =[1, 3, 5, 6, 9]

plt.plot(x, y)
# Drawing vertical line from 25 %
# of the y-axis length to 80 %
# And also increasing the linewidth
plt.axvline(x = 2.5, ymin = 0.25, ymax = 0.80,
            linewidth = 8, color ='green')

plt.show()
輸出:
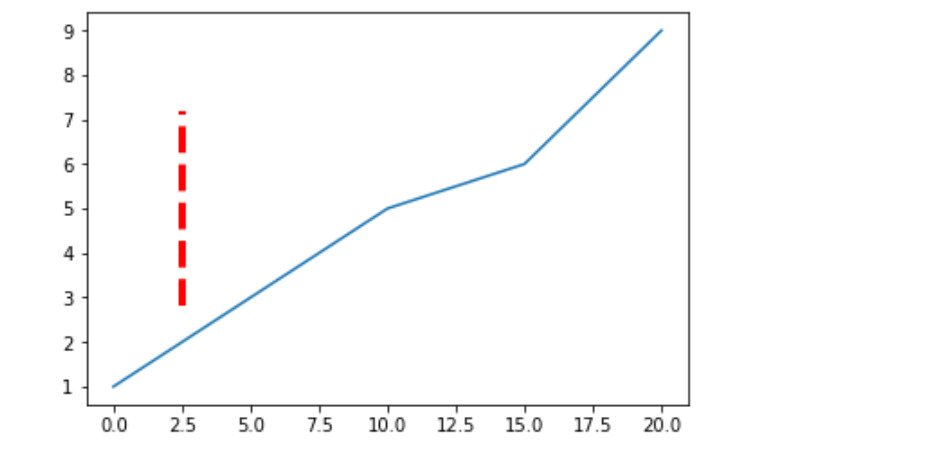
示例3:
import matplotlib.pyplot as plt

x =[0, 5, 10, 15, 20]
y =[1, 3, 5, 6, 9]

plt.plot(x, y)

# Drawing vertical line from 25 %
# of the y-axis length to 75 %
# And also changing the linestyle
plt.axvline(x = 2.5, ymin = 0.25, ymax = 0.75,
            linewidth = 4, linestyle ="--",
            color ='red')

plt.show()
輸出:
注:本文由純淨天空篩選整理自sathvik chiramana大神的英文原創作品 Matplotlib.pyplot.axvline() in Python。非經特殊聲明,原始代碼版權歸原作者所有,本譯文未經允許或授權,請勿轉載或複製。