Matplotlib是一個繪圖庫,用於在Python中創建靜態,動畫和交互式可視化。 Pyplot是Matplotlib模塊,提供MATLAB-like接口。 Matplotlib設計為與MATLAB一樣可用,具有使用Python的能力以及免費和開源的優勢。
matplotlib.pyplot.axis()
此函數用於為圖形設置一些軸屬性。
用法: matplotlib.pyplot.axis(*args, emit=True, **kwargs)
參數:
xmin,xmax,ymin,ymax:這些參數可以用來
在圖形上設置軸限製
emit:它的布爾值用於通知觀察者軸極限變化
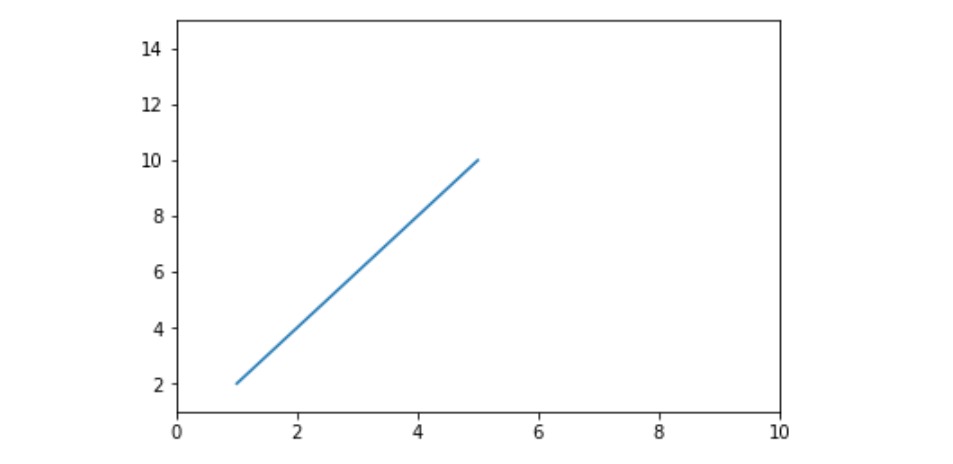
範例1:
import matplotlib.pyplot as plt


x =[1, 2, 3, 4, 5]
y =[2, 4, 6, 8, 10]

# Plotting the graph
plt.plot(x, y)

# Setting the x-axis to 1-10
# and y-axis to 1-15
plt.axis([0, 10, 1, 15])

# Showing the graph with updated axis
plt.show()
輸出:
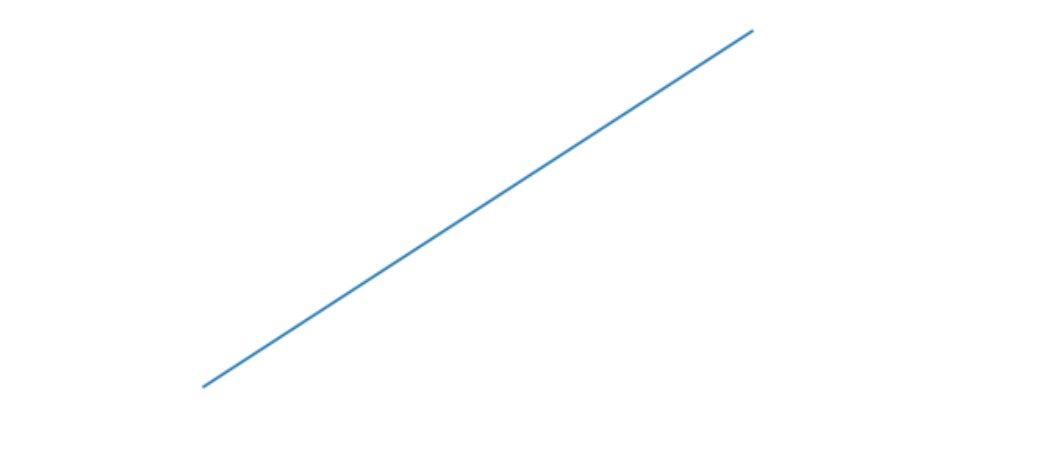
範例2:
import matplotlib.pyplot as plt

x =[1, 2, 3, 4, 5]
y =[2, 4, 6, 8, 10]

plt.plot(x, y)

# we can turn off the axis and display
# only the line by passing the
# optional parameter 'off' to it
plt.axis('off')

plt.show()
輸出:
相關用法
注:本文由純淨天空篩選整理自sathvik chiramana大神的英文原創作品 Matplotlib.pyplot.axis() in Python。非經特殊聲明,原始代碼版權歸原作者所有,本譯文未經允許或授權,請勿轉載或複製。