Matplotlib是Python中令人驚歎的可視化庫,用於數組的二維圖。 Matplotlib是一個基於NumPy數組的多平台數據可視化庫,旨在與更廣泛的SciPy堆棧配合使用。
matplotlib.patches.Wedge
這個 matplotlib.patches.Wedge類用於在圖中添加wedge-shaped個色塊。楔子居中xy = (x, y)半徑為r時,它將theta1掃描到theta2(以度為單位)。如果給定寬度,則從內半徑r-寬度到外半徑r繪製部分楔形。
用法: class matplotlib.patches.Wedge(center, r, theta1, theta2, width=None, **kwargs)
參數:
- centre:楔形的中心點。
- r:楔形的半徑。
- theta1:第一掃角。
- theta2:第二掃描角。
- width:掃描寬度
下表提供了kwargs屬性:
| PROPERTY | DESCRIPTION |
|---|---|
| agg_filter | 一個過濾器函數,它接受一個(m,n,3)浮點數組,一個dpi值返回一個(m,n,3)數組 |
| alpha | 浮點數或無 |
| animated | bool |
| 抗鋸齒或抗鋸齒 | unknown |
| capstyle | {‘butt’,“回合”,‘projecting’} |
| clip_box | Bbox |
| clip_on | bool |
| clip_path | [(Path,Transform)|補丁|無] |
| color | rgba元組的顏色或順序 |
| contains | callable |
| edgecolor或ec或edgecolors | 顏色或無或‘auto’ |
| facecolor或fc或facecolors | 顏色或無 |
| figure | figure |
| fill | bool |
| gid | str |
| hatch | {‘/’、‘\’、‘|’、‘-’、‘+’、‘x’, ‘o’、‘O’、‘.’、‘*’} |
| in_layout | bool |
| joinstyle | {‘miter’,“回合”,‘bevel’} |
| 線型或ls | {“-”,“-”,“-。”,“:”,“,(偏移量,on-off-seq),...} |
| 線寬或線寬或lw | 浮點數或無 |
| path_effects | AbstractPathEffect |
| picker | 無或布爾或浮點數或可贖回 |
| path_effects | AbstractPathEffect |
| picker | float或callable [[Artist,Event],Tuple [bool,dict]] |
| rasterized | 布爾還是無 |
| sketch_params | (比例:浮點數,長度:浮點數,隨機性:浮點數) |
| snap | 布爾還是無 |
| transform | matplotlib.transforms.Transform |
| url | str |
| visible | bool |
| zorder | float |
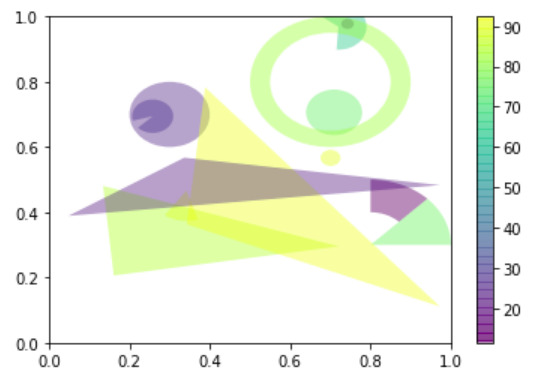
範例1:
import numpy as np
from matplotlib.patches import Circle, Wedge, Polygon
from matplotlib.collections import PatchCollection
import matplotlib.pyplot as plt


# Fixing random state for reproducibility
np.random.seed(19680801)

fig, ax = plt.subplots()

resolution = 50  # the number of vertices
N = 3
x = np.random.rand(N)
y = np.random.rand(N)
radii = 0.1 * np.random.rand(N)
patches = []

for x1, y1, r in zip(x, y, radii):
    circle = Circle((x1, y1), r)
    patches.append(circle)

x = np.random.rand(N)
y = np.random.rand(N)
radii = 0.1 * np.random.rand(N)
theta1 = 360.0 * np.random.rand(N)
theta2 = 360.0 * np.random.rand(N)

for x1, y1, r, t1, t2 in zip(x, y, radii,
                             theta1, theta2):
    wedge = Wedge((x1, y1), r, t1, t2)
    patches.append(wedge)

# Some limiting conditions on Wedge
patches += [
    Wedge((.3, .7), .1, 0, 360),             # Full circle
    Wedge((.7, .8), .2, 0, 360, width = 0.05),  # Full ring
    Wedge((.8, .3), .2, 0, 45),              # Full sector
    Wedge((.8, .3), .2, 45, 90, width = 0.10),  # Ring sector
]

for i in range(N):
    polygon = Polygon(np.random.rand(N, 2), True)
    patches.append(polygon)

colors = 100 * np.random.rand(len(patches))
p = PatchCollection(patches, alpha = 0.4)
p.set_array(np.array(colors))
ax.add_collection(p)
fig.colorbar(p, ax = ax)

plt.show()
輸出:
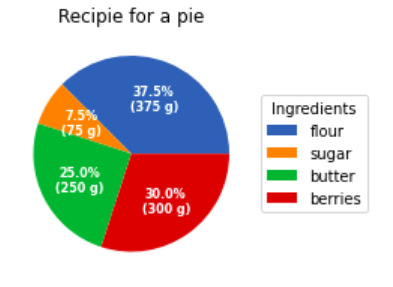
範例2:
import numpy as np
import matplotlib.pyplot as plt


fig, ax = plt.subplots(figsize =(6, 3),
                       subplot_kw = dict(aspect ="equal"))

recipe = ["375 g flour",
          "75 g sugar",
          "250 g butter",
          "300 g berries"]

data = [float(x.split()[0]) for x in recipe]
ingredients = [x.split()[-1] for x in recipe]


def func(pct, allvals):
    absolute = int(pct / 100.*np.sum(allvals))

    return "{:.1f}%\n({:d} g)".format(pct, absolute)


wedges, texts, autotexts = ax.pie(data,
                                  autopct = lambda pct:func(pct, data),
                                  textprops = dict(color ="w"))

ax.legend(wedges, ingredients,
          title ="Ingredients",
          loc ="center left",
          bbox_to_anchor =(1, 0, 0.5, 1))

plt.setp(autotexts, size = 8, weight ="bold")

ax.set_title("Recipie for a pie")

plt.show()
輸出:
注:本文由純淨天空篩選整理自GeeksforGeeks大神的英文原創作品 Matplotlib.patches.Wedge class in Python。非經特殊聲明,原始代碼版權歸原作者所有,本譯文未經允許或授權,請勿轉載或複製。