Matplotlib是Python中的一個庫,它是數字的-NumPy庫的數學擴展。 Figure模塊提供了頂層Artist,即Figure,其中包含所有繪圖元素。此模塊用於控製所有圖元的子圖和頂層容器的默認間距。
matplotlib.figure.Figure.tight_layout()方法
matplotlib庫的tight_layout()方法圖形模塊用於自動調整子圖參數以提供指定的填充。
用法:tight_layout(self, renderer=None, pad=1.08, h_pad=None, w_pad=None, rect=None)
參數:此方法接受下麵討論的以下參數:
- renderer:此參數是RendererBase的子類。
- pad:此參數用於在圖形邊和子圖的邊之間進行填充,以字體大小的一部分表示。
- h_pad,w_pad:這些參數用於相鄰子圖的邊之間的填充(高度/寬度),作為字體大小的一部分。
- rect:此參數是整個子圖區域將適合的歸一化圖形坐標中的矩形。
返回值:此方法不返回任何值。
以下示例說明了matplotlib.figure中的matplotlib.figure.Figure.tight_layout()函數:
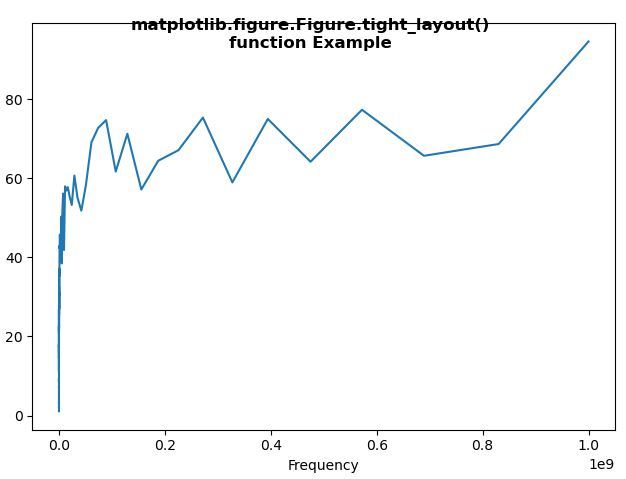
範例1:
import matplotlib.pyplot as plt
import numpy as np
from matplotlib.ticker import EngFormatter


prng = np.random.RandomState(19680801)

xs = np.logspace(1, 9, 100)
ys = (0.8 + 0.4 * prng.uniform(size = 100)) * np.log10(xs)**2

plt.xscale('log')
fig = plt.figure()

ax = fig.subplots()

formatter0 = EngFormatter(unit ='Hz')
ax.plot(xs, ys)
ax.set_xlabel('Frequency')

fig.tight_layout()

fig.suptitle("""matplotlib.figure.Figure.tight_layout()
function Example\n\n""", fontweight ="bold")

fig.show()
輸出:
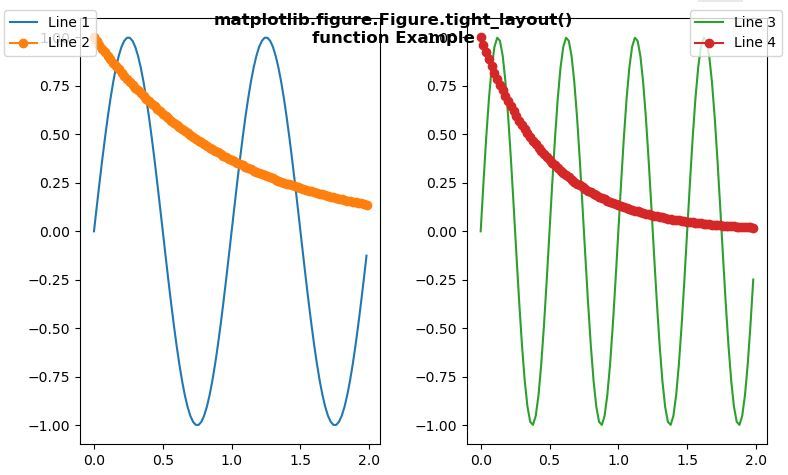
範例2:
import numpy as np
import matplotlib.pyplot as plt


fig, axs = plt.subplots(1, 2)

x = np.arange(0.0, 2.0, 0.02)

y1 = np.sin(2 * np.pi * x)
y2 = np.exp(-x)

l1, = axs[0].plot(x, y1)
l2, = axs[0].plot(x, y2, marker ='o')

y3 = np.sin(4 * np.pi * x)
y4 = np.exp(-2 * x)

l3, = axs[1].plot(x, y3, color ='tab:green')
l4, = axs[1].plot(x, y4, color ='tab:red', marker ='o')

fig.legend((l1, l2), ('Line 1', 'Line 2'), 'upper left')
fig.legend((l3, l4), ('Line 3', 'Line 4'), 'upper right')

fig.tight_layout()

fig.suptitle("""matplotlib.figure.Figure.tight_layout()
function Example\n\n""", fontweight ="bold")
fig.show()
輸出:
相關用法
注:本文由純淨天空篩選整理自SHUBHAMSINGH10大神的英文原創作品 Matplotlib.figure.Figure.tight_layout() in Python。非經特殊聲明,原始代碼版權歸原作者所有,本譯文未經允許或授權,請勿轉載或複製。