Matplotlib是Python中的一個庫,它是數字的-NumPy庫的數學擴展。 Figure模塊提供了頂層Artist,即Figure,其中包含所有繪圖元素。此模塊用於控製所有圖元的子圖和頂層容器的默認間距。
matplotlib.figure.Figure.text()方法
matplotlib庫的text()方法圖形模塊用於向圖形添加文本。
用法:text(self, x, y, s, fontdict=None, withdash=, **kwargs)
參數:此方法接受下麵討論的以下參數:
- x:此參數是放置文本的x位置。
- y:此參數是放置文本的y位置。
- s:此參數是文本字符串。
- fontdict:此參數是用於覆蓋默認文本屬性的字典。
- withdash:此參數用於創建TextWithDash實例而不是Text實例。
返回值:此方法返回Text。
以下示例說明了matplotlib.figure中的matplotlib.figure.Figure.text()函數:
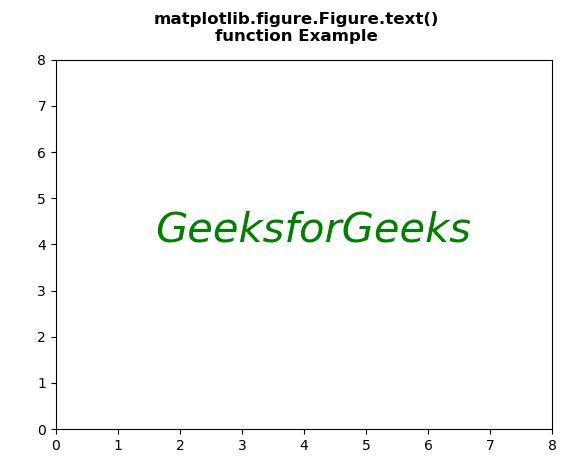
範例1:
#Implementation of matplotlib function
import matplotlib.pyplot as plt


fig, ax = plt.subplots()

fig.text(0.28, 0.5,
         'GeeksforGeeks',
         style = 'italic',
         fontsize = 30,
         color = "green")

ax.set(xlim = (0, 8),
       ylim = (0, 8))

fig.suptitle("""matplotlib.figure.Figure.text()
function Example\n\n""",fontweight="bold")

fig.show()
輸出:
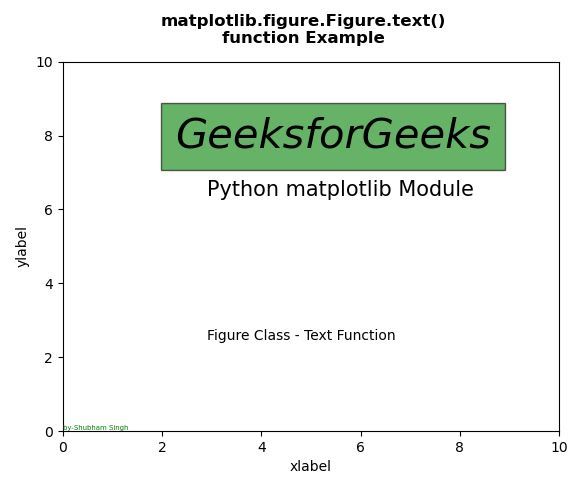
範例2:
# Implementation of matplotlib function
import matplotlib.pyplot as plt

fig, ax = plt.subplots()
ax.set_xlabel('xlabel')
ax.set_ylabel('ylabel')

fig.text(0.3, 0.7,
         'GeeksforGeeks',
         style = 'italic',
         fontsize = 30,
         bbox ={'facecolor':'green',
                'alpha':0.6,
                'pad':10})

fig.text(0.35, 0.6,
         'Python matplotlib Module',
         fontsize = 15)

fig.text(0.35, 0.3,
         'Figure Class - Text Function')

fig.text(0, 0, 'by-Shubham Singh',
        verticalalignment ='bottom',
        horizontalalignment ='left',
        transform = ax.transAxes,
        color ='green',
        fontsize = 5)


ax.set(xlim =(0, 10), ylim =(0, 10))

fig.suptitle("""matplotlib.figure.Figure.text()
function Example\n\n""", fontweight ="bold")

fig.show()
輸出:
相關用法
注:本文由純淨天空篩選整理自SHUBHAMSINGH10大神的英文原創作品 Matplotlib.figure.Figure.text() in Python。非經特殊聲明,原始代碼版權歸原作者所有,本譯文未經允許或授權,請勿轉載或複製。