Matplotlib是Python中的一個庫,它是數字的-NumPy庫的數學擴展。 Figure模塊提供了頂層Artist,即Figure,其中包含所有繪圖元素。此模塊用於控製所有圖元的子圖和頂層容器的默認間距。
matplotlib.figure.Figure.set_tight_layout()方法
matplotlib庫的set_tight_layout()方法圖形模塊用於設置在繪製時是否以及如何調用tight_layout。
用法:set_tight_layout(self, tight)
參數:此方法接受下麵討論的以下參數:
- tight:此參數包含具有鍵“pad”,“w_pad”,“h_pad”,“rect”或無的布爾值或字典。
返回值:此方法不返回任何值。
以下示例說明了matplotlib.figure中的matplotlib.figure.Figure.set_tight_layout()函數:
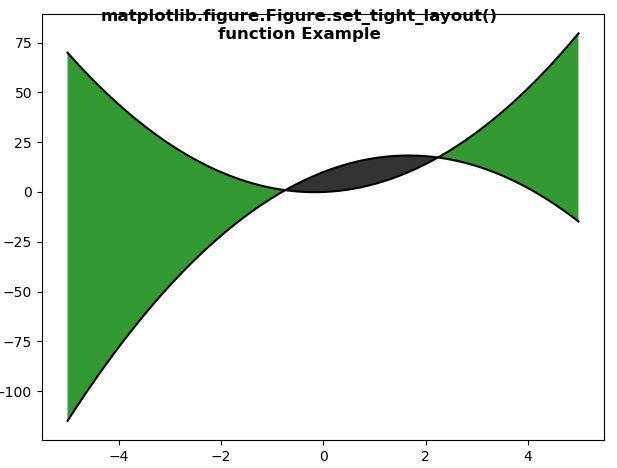
範例1:
# Implementation of matplotlib function
import numpy as np
import matplotlib.pyplot as plt


x = np.arange(-5, 5, 0.01)
y1 = -3*x*x + 10*x + 10
y2 = 3*x*x + x

fig, ax = plt.subplots()
fig.tight_layout()
ax.plot(x, y1, x, y2, color='black')

ax.fill_between(x, y1, y2,
                where = y2 >y1,
                facecolor = 'green',
                alpha = 0.8)

ax.fill_between(x, y1, y2,
                where = y2 <= y1,
                facecolor = 'black',
                alpha = 0.8)

fig.set_tight_layout(True)

fig.canvas.draw()

fig.suptitle("""matplotlib.figure.Figure.set_tight_layout()
function Example\n\n""",fontweight="bold")

plt.show()
輸出:
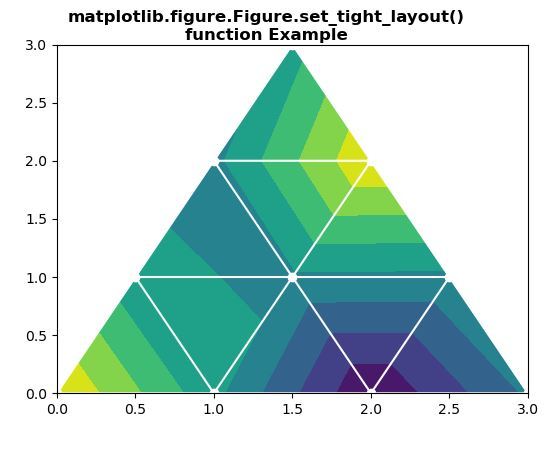
範例2:
# Implementation of matplotlib function
import matplotlib.pyplot as plt
import matplotlib.tri as mtri
import numpy as np


# Create triangulation.
x = np.asarray([0, 1, 2, 3,
                0.5, 1.5,
                2.5, 1, 2,
                1.5])

y = np.asarray([0, 0, 0, 0,
                1.0, 1.0, 1.0,
                2, 2, 3.0])

triangles = [[0, 1, 4], [1, 5, 4],
             [2, 6, 5], [4, 5, 7],
             [5, 6, 8], [5, 8, 7],
             [7, 8, 9], [1, 2, 5],
             [2, 3, 6]]

triang = mtri.Triangulation(x, y, triangles)
z = np.cos(1.5 * x) * np.cos(1.5 * y)

fig, axs = plt.subplots()

axs.tricontourf(triang, z)
axs.triplot(triang, 'go-', color ='white')
fig.tight_layout(rect =(0.1, 0.1, 0.95, 0.95))

fig.set_tight_layout(False)

fig.canvas.draw()

fig.suptitle("""matplotlib.figure.Figure.set_tight_layout()
function Example\n\n""", fontweight ="bold")

plt.show()
輸出:
相關用法
注:本文由純淨天空篩選整理自SHUBHAMSINGH10大神的英文原創作品 Matplotlib.figure.Figure.set_tight_layout() in Python。非經特殊聲明,原始代碼版權歸原作者所有,本譯文未經允許或授權,請勿轉載或複製。