Matplotlib是Python中的一個庫,它是數字的-NumPy庫的數學擴展。 Figure模塊提供了頂層Artist,即Figure,其中包含所有繪圖元素。此模塊用於控製所有圖元的子圖和頂層容器的默認間距。
matplotlib.figure.Figure.legend()方法
matplotlib庫的legend()方法圖形模塊用於在圖形上放置圖例。
用法: legend(self, *args, **kwargs)
參數:此方法接受下麵討論的以下參數:
- handles:此參數是要添加到圖例的藝術家列表(線條,補丁)。
- labels:此參數是在藝術家旁邊顯示的標簽列表。
返回值:此方法返回matplotlib.legend.Legend實例。
以下示例說明了matplotlib.figure中的matplotlib.figure.Figure.legend()函數:
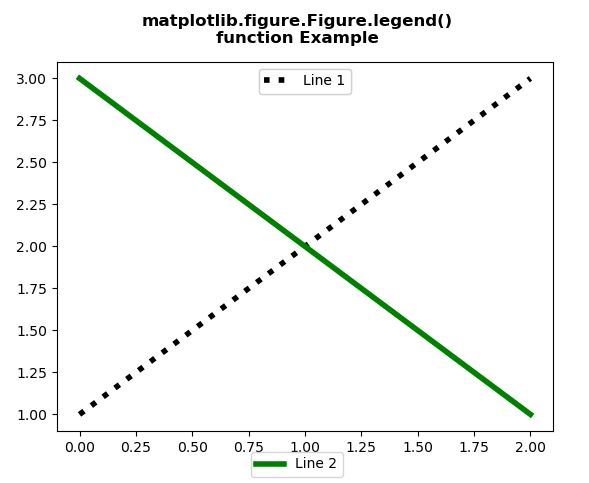
範例1:
# Implementation of matplotlib function
import matplotlib.pyplot as plt

fig, ax = plt.subplots()

line1, = ax.plot([1, 2, 3],
                 label ="Line 1",
                 color ="black",
                 linewidth = 4,
                 linestyle =':')

line2, = ax.plot([3, 2, 1],
                 label ="Line 2",
                 color ="green",
                 linewidth = 4)


first_legend = ax.legend(handles =[line1],
                         loc ='upper center')

ax.add_artist(first_legend)

fig.legend(handles =[line2], loc ='lower center')

fig.suptitle("""matplotlib.figure.Figure.legend()
function Example\n\n""", fontweight ="bold")

plt.show()
輸出:
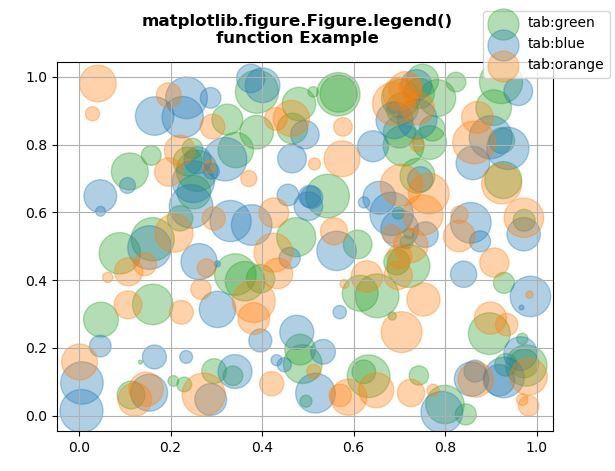
範例2:
# Implementation of matplotlib function
import numpy as np
np.random.seed(19680801)
import matplotlib.pyplot as plt


fig, ax = plt.subplots()
for color in [ 'tab:green', 'tab:blue', 'tab:orange']:
    n = 70
    x, y = np.random.rand(2, n)
    scale = 1000.0 * np.random.rand(n)
    ax.scatter(x, y, c = color, s = scale, label = color,
               alpha = 0.35)

fig.legend()
ax.grid(True)

fig.suptitle("""matplotlib.figure.Figure.legend()
function Example\n\n""", fontweight ="bold")

plt.show()
輸出:
相關用法
注:本文由純淨天空篩選整理自SHUBHAMSINGH10大神的英文原創作品 Matplotlib.figure.Figure.legend() in Python。非經特殊聲明,原始代碼版權歸原作者所有,本譯文未經允許或授權,請勿轉載或複製。