Matplotlib是Python中的一個庫,它是數字的-NumPy庫的數學擴展。 Figure模塊提供了頂層Artist,即Figure,其中包含所有繪圖元素。此模塊用於控製所有圖元的子圖和頂層容器的默認間距。
matplotlib.figure.Figure.init_layoutbox()方法
matplotlib庫的init_layoutbox()方法圖形模塊用於初始化布局盒,以用於constrained_layout。
用法:init_layoutbox(self)
參數:此方法不接受任何參數。
返回:此方法不返回任何值。
以下示例說明了matplotlib.figure中的matplotlib.figure.Figure.init_layoutbox()函數:
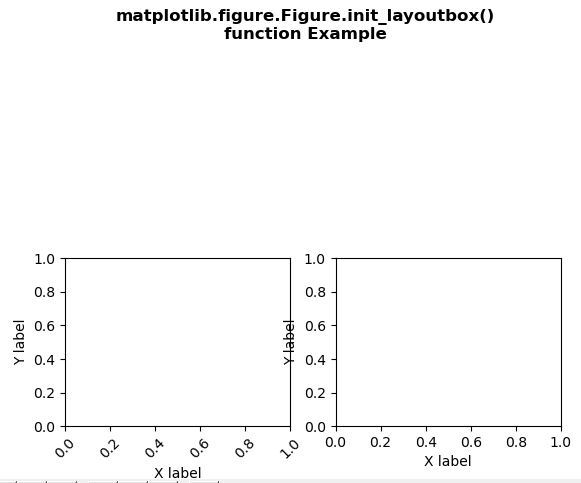
範例1:
# Implementation of matplotlib function
import matplotlib.pyplot as plt
import numpy as np
import matplotlib.gridspec as gridspec

fig = plt.figure()
gs = gridspec.GridSpec(2, 2)

for i in range(2):
    ax = fig.add_subplot(gs[1, i])
    ax.set_ylabel('Y label')
    ax.set_xlabel('X label')
    if i == 0:
        for tick in ax.get_xticklabels():
            tick.set_rotation(45)

fig.init_layoutbox()

fig.suptitle("""matplotlib.figure.Figure.init_layoutbox()
function Example\n\n""", fontweight ="bold")

plt.show()
輸出:
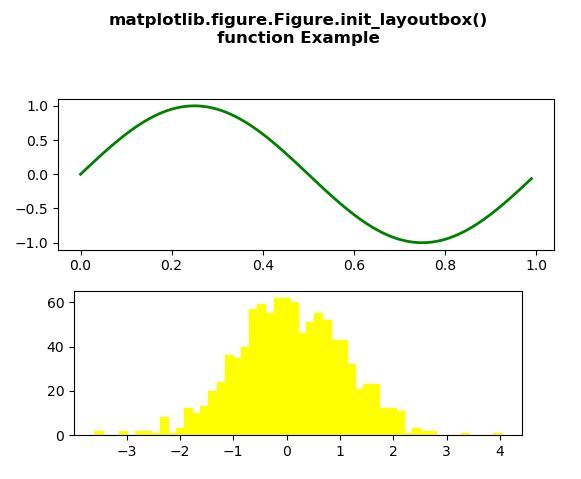
範例2:
# Implementation of matplotlib function
import numpy as np
import matplotlib.pyplot as plt


fig = plt.figure()
fig.subplots_adjust(top = 0.8)
ax1 = fig.add_subplot(211)

t = np.arange(0.0, 1.0, 0.01)
s = np.sin(2 * np.pi * t)
line, = ax1.plot(t, s, color ='green', lw = 2)

np.random.seed(19680801)

ax2 = fig.add_axes([0.15, 0.1, 0.7, 0.3])
n, bins, patches = ax2.hist(np.random.randn(1000), 50,
                            facecolor ='yellow',
                            edgecolor ='yellow')

fig.init_layoutbox()

fig.suptitle("""matplotlib.figure.Figure.init_layoutbox()
function Example\n\n""", fontweight ="bold")

plt.show()
輸出:
相關用法
注:本文由純淨天空篩選整理自SHUBHAMSINGH10大神的英文原創作品 Matplotlib.figure.Figure.init_layoutbox() in Python。非經特殊聲明,原始代碼版權歸原作者所有,本譯文未經允許或授權,請勿轉載或複製。