Matplotlib是Python中的一個庫,它是數字的-NumPy庫的數學擴展。 Figure模塊提供了頂層Artist,即Figure,其中包含所有繪圖元素。此模塊用於控製所有圖元的子圖和頂層容器的默認間距。
matplotlib.figure.Figure()類
此類是所有圖元素的頂級容器。Figure實例通過作為CallbackRegistry實例的callbacks屬性支持回調。
注意:在圖中,基礎是matplotlib.artist.Artist。
用法: class matplotlib.figure.Figure(figsize=None, dpi=None, facecolor=None, edgecolor=None, linewidth=0.0, frameon=None, subplotpars=None, tight_layout=None, constrained_layout=None)
參數:這接受以下描述的以下參數:
- figsize:此參數是圖形尺寸(寬度,高度),以英寸為單位。
- dpi:此參數是每英寸的點數。
- facecolor:此參數是圖形補丁的麵色。
- edgecolor:此參數是圖形補丁邊顏色。
- linewidth:此參數是框架的線寬。
- frameon:此參數是禁止繪製圖形背景補丁。
- subplotpars:此參數是子圖參數。
- tight_layout:此參數用於調整子圖參數。
- constrained_layout:此參數用於調整繪圖元素的位置。
返回值:此方法返回圖形實例。
以下示例說明了matplotlib.figure中的matplotlib.figure.Figure()函數:
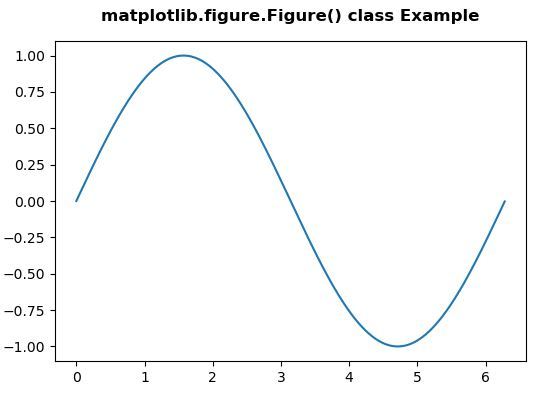
範例1:
# Implementation of matplotlib function
import matplotlib.pyplot as plt
from matplotlib.figure import Figure
import numpy as np


fig = plt.figure(figsize =(5, 4))

ax = fig.add_axes([0.1, 0.1, 0.8, 0.8])

xx = np.arange(0, 2 * np.pi, 0.01)
ax.plot(xx, np.sin(xx))

fig.suptitle('matplotlib.figure.Figure() class Example\n\n',
             fontweight ="bold")

plt.show()
輸出:
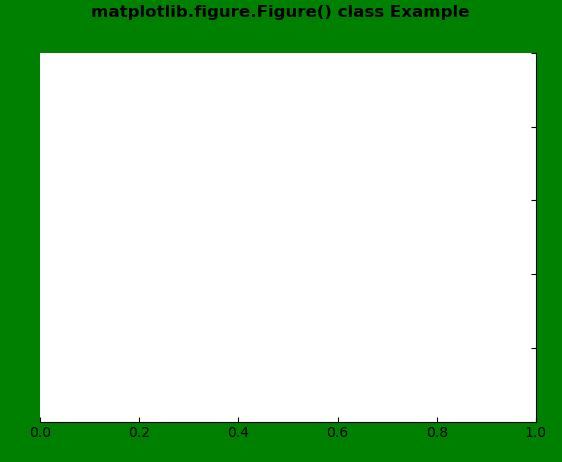
示例2:
# Implementation of matplotlib function
import matplotlib.pyplot as plt
from matplotlib.figure import Figure
from mpl_toolkits.axisartist.axislines import Subplot
import numpy as np


fig = plt.figure(facecolor ="green")

ax = Subplot(fig, 111)
fig.add_subplot(ax)

ax.axis["left"].set_visible(False)
ax.axis["top"].set_visible(False)

fig.suptitle('matplotlib.figure.Figure() class Example\n\n',
             fontweight ="bold")

plt.show()
輸出:
相關用法
注:本文由純淨天空篩選整理自SHUBHAMSINGH10大神的英文原創作品 Matplotlib.figure.Figure() in Python。非經特殊聲明,原始代碼版權歸原作者所有,本譯文未經允許或授權,請勿轉載或複製。