Matplotlib是Python中的一個庫,它是數字的-NumPy庫的數學擴展。 Figure模塊提供了頂層Artist,即Figure,其中包含所有繪圖元素。此模塊用於控製所有圖元的子圖和頂層容器的默認間距。
matplotlib.figure.Figure.get_edgecolor()方法
matplotlib庫的get_edgecolor()方法圖形模塊用於獲取圖形矩形的邊顏色。
用法: get_edgecolor(self)
參數:此方法不接受任何參數。
返回:此方法返回Figure矩形的邊顏色。
以下示例說明了matplotlib.figure中的matplotlib.figure.Figure.get_edgecolor()函數:
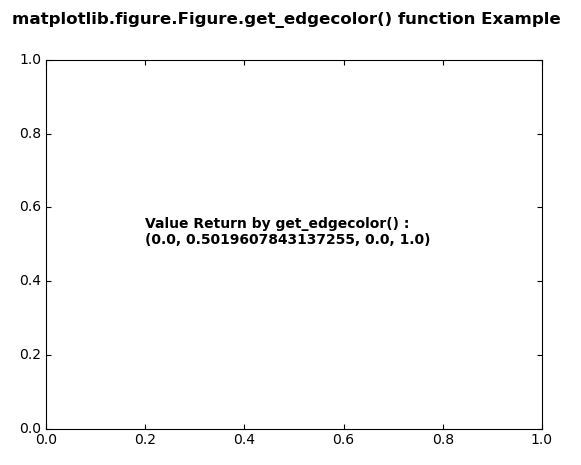
範例1:
# Implementation of matplotlib function
import matplotlib.pyplot as plt
from matplotlib.figure import Figure
from mpl_toolkits.axisartist.axislines import Subplot
import numpy as np

fig = plt.figure(edgecolor ="green")

ax = Subplot(fig, 111)
fig.add_subplot(ax)


w = fig.get_edgecolor()
ax.text(0.2, 0.5, "Value Return by get_edgecolor():\n"
        +str(w),
        fontweight ="bold")

fig.canvas.draw()
fig.suptitle('matplotlib.figure.Figure.get_edgecolor() \
function Example', fontweight ="bold")

plt.show()
輸出:
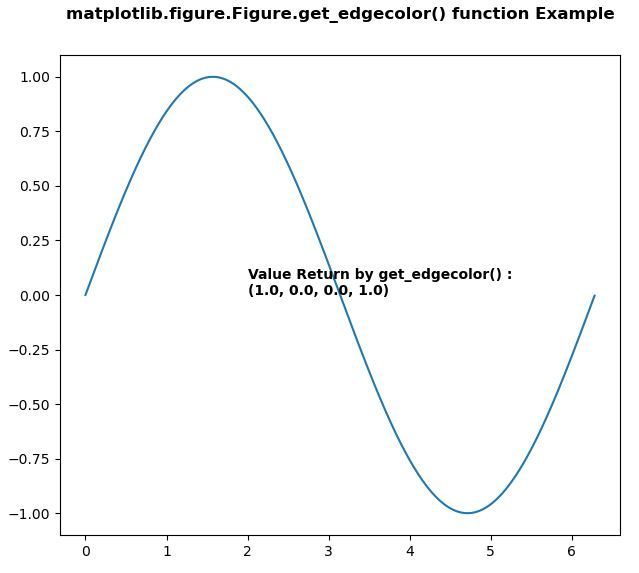
範例2:
# Implementation of matplotlib function
import matplotlib.pyplot as plt
from matplotlib.figure import Figure
import numpy as np


fig = plt.figure(edgecolor = "red", figsize =(7, 6))

ax = fig.add_axes([0.1, 0.1, 0.8, 0.8])

xx = np.arange(0, 2 * np.pi, 0.01)
ax.plot(xx, np.sin(xx))

w = fig.get_edgecolor()
ax.text(2, 0, "Value Return by get_edgecolor():\n"
        + str(w),
        fontweight ="bold")

fig.canvas.draw()
fig.suptitle('matplotlib.figure.Figure.get_edgecolor()\
 function Example', fontweight ="bold")

plt.show()
輸出:
相關用法
注:本文由純淨天空篩選整理自SHUBHAMSINGH10大神的英文原創作品 Matplotlib.figure.Figure.get_edgecolor() in Python。非經特殊聲明,原始代碼版權歸原作者所有,本譯文未經允許或授權,請勿轉載或複製。