Matplotlib是Python中的一個庫,它是數字的-NumPy庫的數學擴展。 Figure模塊提供了頂層Artist,即Figure,其中包含所有繪圖元素。此模塊用於控製所有圖元的子圖和頂層容器的默認間距。
matplotlib.figure.Figure.get_default_bbox_extra_artists()方法
matplotlib庫的get_default_bbox_extra_artists()方法圖形模塊用於獲取用於邊界框計算的藝術家的默認列表。
用法: get_default_bbox_extra_artists(self)
參數:此方法不接受任何參數。
返回:此方法返回用於邊界框計算的藝術家的默認列表。
以下示例說明了matplotlib.figure中的matplotlib.figure.Figure.get_default_bbox_extra_artists()函數:
範例1:
# ImpleIn Reviewtation of matplotlib function
import matplotlib.pyplot as plt
import matplotlib.tri as tri
import numpy as np

n_angles = 36
n_radii = 10
min_radius = 2
radii = np.linspace(min_radius, 0.95, n_radii)

angles = np.linspace(0, 2 * np.pi,
                     n_angles,
                     endpoint = False)
angles = np.repeat(angles[..., np.newaxis],
                   n_radii,
                   axis = 1)
angles[:, 1::2] += 2 * np.pi / n_angles

x = (radii * np.cos(angles)).flatten()
y = (radii * np.sin(angles)).flatten()

triang = tri.Triangulation(x, y)

triang.set_mask(np.hypot(x[triang.triangles].mean(axis = 1),
                         y[triang.triangles].mean(axis = 1))
                < min_radius)
fig, ax = plt.subplots()

ax.triplot(triang, 'bo-', lw = 1, color = "green")

w = fig.get_default_bbox_extra_artists()

print("Value Return by get_default_bbox_extra_artists():")
for i in w:
    print(i)

fig.canvas.draw()
fig.suptitle('matplotlib.figure.Figure.get_default_bbox_extra_artists()\
function Example', fontweight ="bold")

plt.show()
輸出:
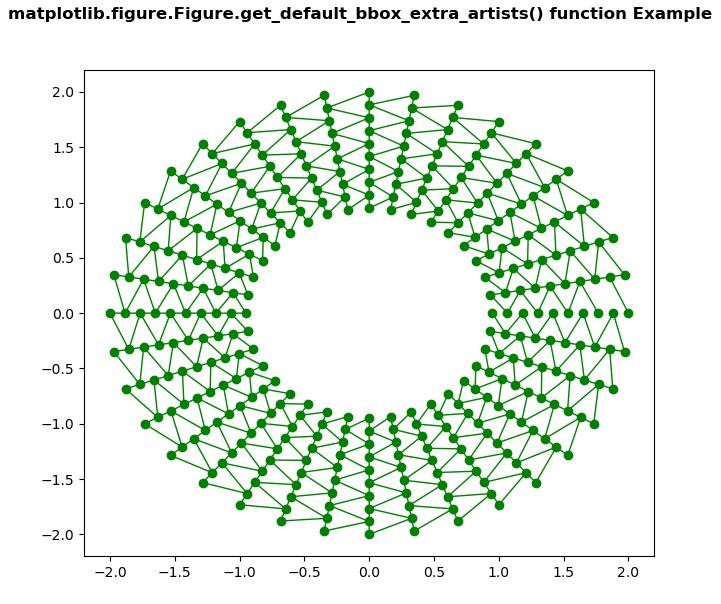
Value Return by get_default_bbox_extra_artists():
AxesSubplot(0.125, 0.11;0.775x0.77)
Line2D(_line0)
Line2D(_line1)
Spine
Spine
Spine
Spine
XAxis(80.0, 52.8)
YAxis(80.0, 52.8)
Text(0.5, 1.0, '')
Text(0.0, 1.0, '')
Text(1.0, 1.0, '')
Rectangle(xy=(0, 0), width=1, height=1, angle=0)
範例2:
# ImpleIn Reviewtation of matplotlib function
import matplotlib.pyplot as plt


fig, ax1 = plt.subplots( )

ax1.set_xscale("log")
ax1.set_yscale("log")

ax1.set_adjustable("datalim")
ax1.plot([1, 3, 34, 4, 46,
          3, 7, 45, 10],
         [1, 9, 27, 8, 29,
          84, 78, 19, 48],
         "o-",
         color ="green")

ax1.set_xlim(1e-1, 1e2)
ax1.set_ylim(1, 1e2)

w = fig.get_default_bbox_extra_artists()

print("Value Return by get_default_bbox_extra_artists():")

for i in w:
    print(i)

fig.canvas.draw()
fig.suptitle('matplotlib.figure.Figure.get_default_bbox_extra_artists()\
function Example', fontweight ="bold")

plt.show()
輸出:
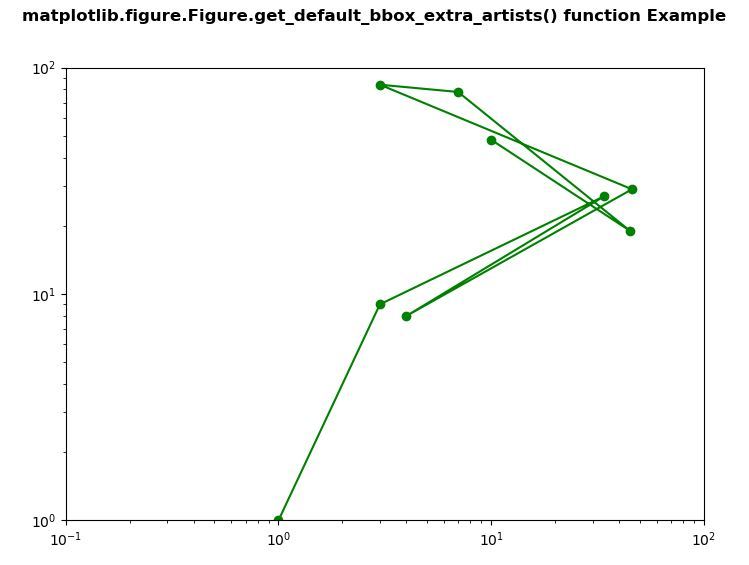
Value Return by get_default_bbox_extra_artists():
AxesSubplot(0.125, 0.11;0.775x0.77)
Line2D(_line0)
Spine
Spine
Spine
Spine
XAxis(80.0, 52.8)
YAxis(80.0, 52.8)
Text(0.5, 1.0, '')
Text(0.0, 1.0, '')
Text(1.0, 1.0, '')
Rectangle(xy=(0, 0), width=1, height=1, angle=0)
相關用法
注:本文由純淨天空篩選整理自SHUBHAMSINGH10大神的英文原創作品 Matplotlib.figure.Figure.get_default_bbox_extra_artists() in Python。非經特殊聲明,原始代碼版權歸原作者所有,本譯文未經允許或授權,請勿轉載或複製。