Matplotlib是Python中的一個庫,它是數字的-NumPy庫的數學擴展。 Figure模塊提供了頂層Artist,即Figure,其中包含所有繪圖元素。此模塊用於控製所有圖元的子圖和頂層容器的默認間距。
matplotlib.figure.Figure.figimage()函數
matplotlib庫的圖形模塊的figimage()方法用於向圖形添加未重采樣的圖像。
用法: figimage(self, X, xo=0, yo=0, alpha=None, norm=None, cmap=None, vmin=None, vmax=None, origin=None, resize=False, **kwargs)
參數:這接受以下描述的以下參數:
- X:此參數是圖像數據。
- xo, yo:這些參數是以像素為單位的x /y圖像偏移量。
- alpha:此參數是Alpha混合值。
- norm:此參數是Normalize實例,用於將亮度映射到間隔[0,1]。
- cmap:此參數是要使用的顏色圖。
- vmin, vmax:這些參數是顏色圖的數據限製。
- origin:此參數指示數組的[0,0]索引在軸的左上角或左下角的位置。
- resize:此參數用於調整圖形大小以匹配給定的圖像大小。
返回值:此方法返回matplotlib.image.FigureImage。
以下示例說明了matplotlib.figure中的matplotlib.figure.Figure.figimage()函數:
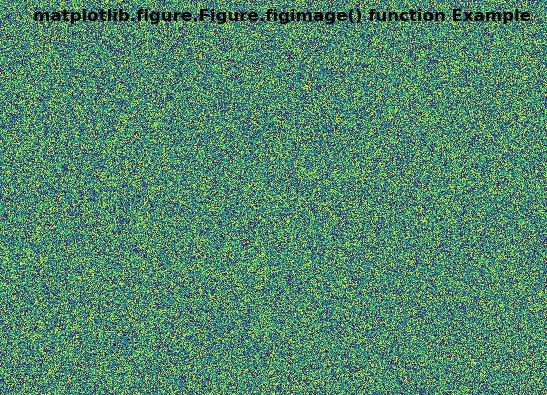
範例1:
# Implementation of matplotlib function
import matplotlib.pyplot as plt
import numpy as np

fig = plt.figure()
nx = int(fig.get_figwidth() * fig.dpi)
ny = int(fig.get_figheight() * fig.dpi)
data = np.random.random((ny, nx))
fig.figimage(data)

fig.suptitle('matplotlib.figure.Figure.figimage()\
function Example', fontweight ="bold")

plt.show()
輸出:
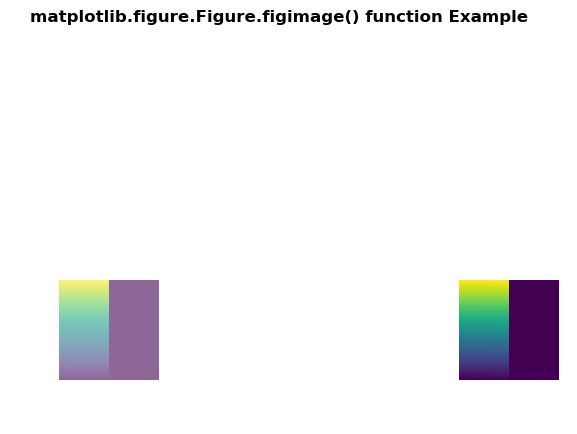
範例2:
# Implementation of matplotlib function
import numpy as np
import matplotlib
import matplotlib.pyplot as plt


fig = plt.figure()
Z = np.arange(10000).reshape((100, 100))
Z[:, 50:] = 1

im1 = fig.figimage(Z, xo = 500, yo = 100,
                   origin ='lower')

im2 = fig.figimage(Z, xo = 100, yo = 100,
                   alpha =.6,
                   origin ='lower')

fig.suptitle('matplotlib.figure.Figure.figimage() \
function Example', fontweight ="bold")

plt.show()
輸出:
相關用法
注:本文由純淨天空篩選整理自SHUBHAMSINGH10大神的英文原創作品 Matplotlib.figure.Figure.figimage() in Python。非經特殊聲明,原始代碼版權歸原作者所有,本譯文未經允許或授權,請勿轉載或複製。