Matplotlib是Python中的一個庫,它是數字的-NumPy庫的數學擴展。 Figure模塊提供了頂層Artist,即Figure,其中包含所有繪圖元素。此模塊用於控製所有圖元的子圖和頂層容器的默認間距。
matplotlib.figure.Figure.draw()函數
matplotlib庫的draw()方法圖形模塊用於使用matplotlib.backend_bases.RendererBase實例渲染器來渲染圖形。
用法: draw(self, renderer)
參數:這接受以下描述的以下參數:
- renderer:此參數是matplotlib.backend_bases.RendererBase實例渲染器。
返回值:此方法不返回任何值。
以下示例說明了matplotlib.figure中的matplotlib.figure.Figure.draw()函數:
範例1:
# Implementation of matplotlib function
from mpl_toolkits.mplot3d import axes3d
import matplotlib.pyplot as plt

fig, ax = plt.subplots()

def tellme(s):
    ax.set_title(s, fontsize = 16)
    fig.canvas.draw()
    renderer = fig.canvas.renderer
    fig.draw(renderer)

tellme('matplotlib.figure.Figure.draw() \
function Example')

plt.show()
輸出:
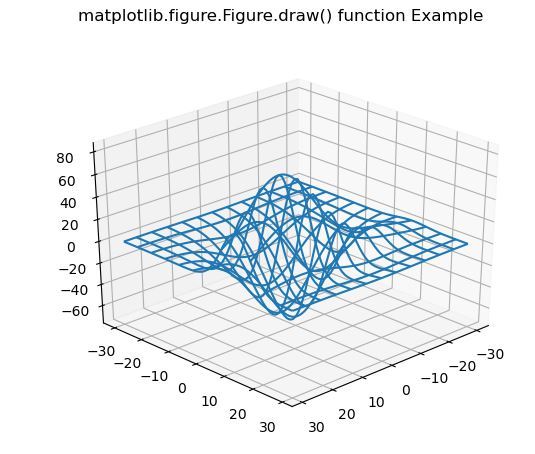
範例2:
# Implementation of matplotlib function
from mpl_toolkits.mplot3d import axes3d
import matplotlib.pyplot as plt


fig = plt.figure()
ax = fig.add_subplot(111, projection ='3d')

X, Y, Z = axes3d.get_test_data(0.1)
ax.plot_wireframe(X, Y, Z, rstride = 5,
                  cstride = 5)

for angle in range(0, 90):
    ax.view_init(30, angle)
    fig.canvas.draw()
    renderer = fig.canvas.renderer
    fig.draw(renderer)
    plt.pause(.001)

    fig.suptitle('matplotlib.figure.Figure.draw() \
    function Example')
輸出:
相關用法
注:本文由純淨天空篩選整理自SHUBHAMSINGH10大神的英文原創作品 Matplotlib.figure.Figure.draw() in Python。非經特殊聲明,原始代碼版權歸原作者所有,本譯文未經允許或授權,請勿轉載或複製。