Matplotlib是Python中的一個庫,它是數字的-NumPy庫的數學擴展。 Figure模塊提供了頂層Artist,即Figure,其中包含所有繪圖元素。此模塊用於控製所有圖元的子圖和頂層容器的默認間距。
matplotlib.figure.Figure.dpi方法
matplotlib庫圖形模塊的dpi方法是每英寸點數的分辨率。
用法: fig.dpi
參數:此方法不接受任何參數。
返回:此方法以每英寸點數返回分辨率。
以下示例說明了matplotlib.figure中的matplotlib.figure.Figure.dpi函數:
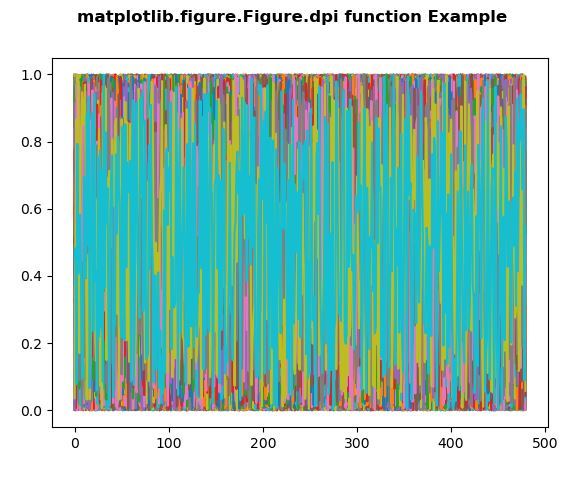
範例1:
# Implementation of matplotlib function
import matplotlib.pyplot as plt
import numpy as np


fig = plt.figure()

nx = int(fig.get_figwidth() * fig.dpi)
ny = int(fig.get_figheight() * fig.dpi)

data = np.random.random((ny, nx))
plt.plot(data)

fig.suptitle('matplotlib.figure.Figure.dpi \
function Example', fontweight ="bold")

plt.show()
輸出:
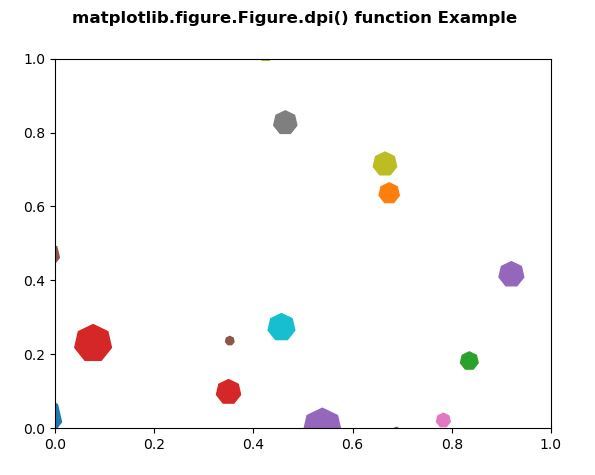
範例2:
# Implementation of matplotlib function
import matplotlib.pyplot as plt
from matplotlib import collections, colors, transforms
import numpy as np

nverts = 50
npts = 100

r = np.arange(nverts)
theta = np.linspace(0, 2 * np.pi, nverts)

xx = r * np.sin(theta)
yy = r * np.cos(theta)

spiral = np.column_stack([xx, yy])

rs = np.random.RandomState(19680801)

xyo = rs.randn(npts, 2)

colors = [colors.to_rgba(c)
          for c in plt.rcParams['axes.prop_cycle'].by_key()['color']]

fig, ax1 = plt.subplots()

col = collections.RegularPolyCollection(
    7, sizes = np.abs(xx) * 10.0, offsets = xyo,
    transOffset = ax1.transData)

trans = transforms.Affine2D().scale(fig.dpi / 72.0)

col.set_transform(trans)
ax1.add_collection(col, autolim = True)
col.set_color(colors)

fig.suptitle('matplotlib.figure.Figure.dpi() function\
 Example', fontweight ="bold")

plt.show()
輸出:
相關用法
注:本文由純淨天空篩選整理自SHUBHAMSINGH10大神的英文原創作品 Matplotlib.figure.Figure.dpi() in Python。非經特殊聲明,原始代碼版權歸原作者所有,本譯文未經允許或授權,請勿轉載或複製。