Matplotlib是Python中的一個庫,它是數字的-NumPy庫的數學擴展。 Figure模塊提供了頂層Artist,即Figure,其中包含所有繪圖元素。此模塊用於控製所有圖元的子圖和頂層容器的默認間距。
matplotlib.figure.Figure.colorbar()函數
matplotlib庫的圖形模塊的colorbar()方法用於向繪圖添加顏色條。
用法: colorbar(self, mappable, cax=None, ax=None, use_gridspec=True, **kw)
參數:這接受以下描述的以下參數:
- mappable:對於Figure.colorbar方法,此參數是必需的。
- cax:此參數是顏色條將繪製到的軸。
- ax:此參數是父軸,將從中竊取用於新彩條軸的空間。
- use_gridspec:此參數用於使用gridspec模塊創建Subplot的實例。
返回值:此方法不返回任何值。
以下示例說明了matplotlib.figure中的matplotlib.figure.Figure.colorbar()函數:
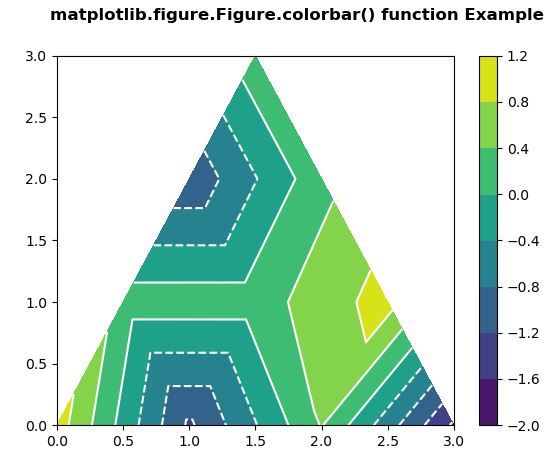
範例1:
# Implementation of matplotlib function
import matplotlib.pyplot as plt
import matplotlib.tri as mtri
import numpy as np

# Create triangulation.
x = np.asarray([0, 1, 2, 3, 0.5,
                1.5, 2.5, 1, 2,
                1.5])

y = np.asarray([0, 0, 0, 0, 1.0,
                1.0, 1.0, 2, 2,
                3.0])

triangles = [[0, 1, 4], [1, 5, 4],
             [2, 6, 5], [4, 5, 7],
             [5, 6, 8], [5, 8, 7],
             [7, 8, 9], [1, 2, 5],
             [2, 3, 6]]

triang = mtri.Triangulation(x, y, triangles)
z = np.cos(3 * x) * np.cos(6 * y)+np.sin(6 * x)

fig, axs = plt.subplots()
t = axs.tricontourf(triang, z)
axs.tricontour(triang, z, colors ='white')
fig.colorbar(t)

fig.suptitle('matplotlib.figure.Figure.colorbar() \
function Example\n\n', fontweight ="bold")

plt.show()
輸出:
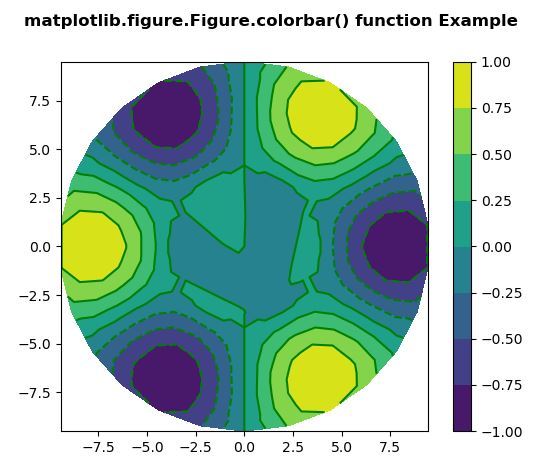
範例2:
# Implementation of matplotlib function
import matplotlib.pyplot as plt
import matplotlib.tri as tri
import numpy as np

n_angles = 26
n_radii = 10
min_radius = 0.35
radii = np.linspace(min_radius,
                    0.95,
                    n_radii)

angles = np.linspace(0, 2 * np.pi,
                     n_angles,
                     endpoint = False)

angles = np.repeat(angles[..., np.newaxis],
                   n_radii,
                   axis = 1)

angles[:, 1::2] += np.pi / n_angles

x = (10 * radii * np.cos(angles)).flatten()
y = (10 * radii * np.sin(angles)).flatten()
z = (np.cos(4 * radii) * np.cos(3 * angles)).flatten()

triang = tri.Triangulation(x, y)

triang.set_mask(np.hypot(x[triang.triangles].mean(axis = 1),
                         y[triang.triangles].mean(axis = 1))
                < min_radius)

fig1, ax1 = plt.subplots()
ax1.set_aspect('equal')
tcf = ax1.tricontourf(triang, z)
fig1.colorbar(tcf)
ax1.tricontour(triang, z, colors ='g')

fig1.suptitle('matplotlib.figure.Figure.colorbar()\
function Example\n\n', fontweight ="bold")

plt.show()
輸出:
相關用法
注:本文由純淨天空篩選整理自SHUBHAMSINGH10大神的英文原創作品 Matplotlib.figure.Figure.colorbar() in Python。非經特殊聲明,原始代碼版權歸原作者所有,本譯文未經允許或授權,請勿轉載或複製。