Matplotlib是Python中的一個庫,它是數字的-NumPy庫的數學擴展。 Figure模塊提供了頂層Artist,即Figure,其中包含所有繪圖元素。此模塊用於控製所有圖元的子圖和頂層容器的默認間距。
matplotlib.figure.Figure.autofmt_xdate()函數
matplotlib庫的autofmt_xdate()方法圖形模塊用於旋轉它們並使其右對齊。
用法: autofmt_xdate(self, bottom=0.2, rotation=30, ha=’right’, which=None)
參數:這接受以下描述的以下參數:
- bottom:此參數是subplots_adjust()子圖的底部。
- rotation:此參數是xtick標簽的旋轉。
- ha:此參數是xticklabels的水平對齊方式。
- which:此參數選擇要旋轉的刻度標簽。
返回值:此方法不返回任何值。
以下示例說明了matplotlib.figure中的matplotlib.figure.Figure.autofmt_xdate()函數:
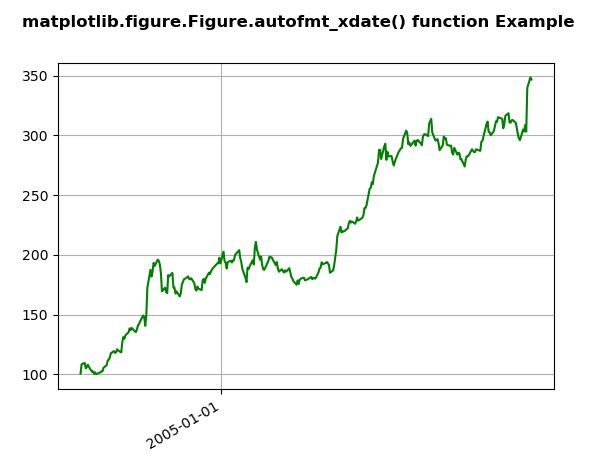
範例1:
# Implementation of matplotlib function
import numpy as np
import matplotlib.pyplot as plt
import matplotlib.dates as mdates
import matplotlib.cbook as cbook

years = mdates.YearLocator()
months = mdates.MonthLocator()
years_fmt = mdates.DateFormatter('% Y')

with cbook.get_sample_data('goog.npz') as datafile:
    data = np.load(datafile)['price_data'].view(np.recarray)

fig, ax = plt.subplots()
ax.plot('date', 'adj_close',
         data = data[:300],
         color ="green")

ax.xaxis.set_major_locator(years)
ax.format_ydata = lambda x:'$% 1.2f' % x
ax.grid(True)

fig.autofmt_xdate()

fig.suptitle('matplotlib.figure.Figure.autofmt_xdate() \
function Example\n\n', fontweight ="bold")

plt.show()
輸出:
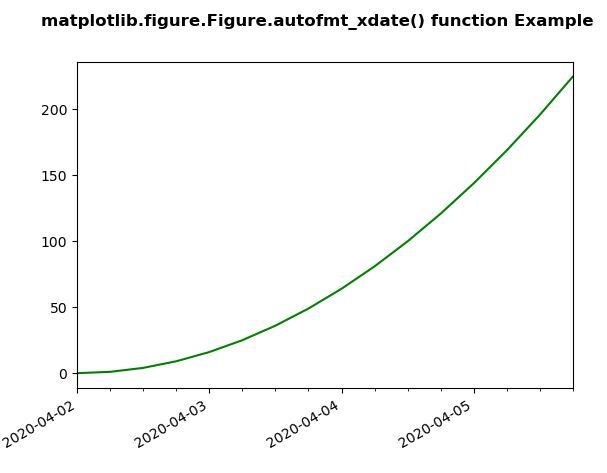
範例2:
# Implementation of matplotlib function
import datetime
import matplotlib.pyplot as plt
from matplotlib.dates import DayLocator, HourLocator, DateFormatter, drange
import numpy as np

date1 = datetime.datetime(2020, 4, 2)
date2 = datetime.datetime(2020, 4, 6)
delta = datetime.timedelta(hours = 6)
dates = drange(date1, date2, delta)

y = np.arange(len(dates))

fig, ax = plt.subplots()
ax.plot_date(dates, y ** 2, 'g')

ax.set_xlim(dates[0], dates[-1])

ax.xaxis.set_major_locator(DayLocator())
ax.xaxis.set_minor_locator(HourLocator(range(0, 25, 6)))
ax.xaxis.set_major_formatter(DateFormatter('% Y-% m-% d'))

ax.fmt_xdata = DateFormatter('% Y-% m-% d % H:% M:% S')
fig.autofmt_xdate()

fig.suptitle('matplotlib.figure.Figure.autofmt_xdate() \
function Example\n\n', fontweight ="bold")

plt.show()
輸出:
相關用法
注:本文由純淨天空篩選整理自SHUBHAMSINGH10大神的英文原創作品 Matplotlib.figure.Figure.autofmt_xdate() in Python。非經特殊聲明,原始代碼版權歸原作者所有,本譯文未經允許或授權,請勿轉載或複製。