Matplotlib是Python中的一個庫,它是數字的-NumPy庫的數學擴展。 Figure模塊提供了頂層Artist,即Figure,其中包含所有繪圖元素。此模塊用於控製所有圖元的子圖和頂層容器的默認間距。
matplotlib.figure.Figure.align_ylabels()函數
如果自動進行標簽對齊,則matplotlib庫的align_ylabels()方法圖形模塊用於將子圖的ylabel與相同的子圖行或列對齊。
用法: align_ylabels(self, axs=None)
參數:這接受以下描述的以下參數:
- axs:此參數是用於對齊ylabel的軸的列表。
返回值:此方法不返回任何值。
以下示例說明了matplotlib.figure中的matplotlib.figure.Figure.align_ylabels()函數:
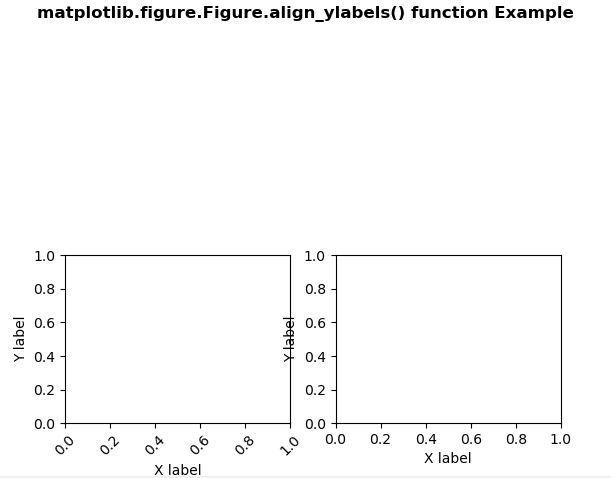
範例1:
# Implementation of matplotlib function
import matplotlib.pyplot as plt
import numpy as np
import matplotlib.gridspec as gridspec

fig = plt.figure()
gs = gridspec.GridSpec(2, 2)

for i in range(2):
    ax = fig.add_subplot(gs[1, i])
    ax.set_ylabel('Y label')
    ax.set_xlabel('X label')
    if i == 0:
        for tick in ax.get_xticklabels():
            tick.set_rotation(45)

fig.align_ylabels()

fig.suptitle('matplotlib.figure.Figure.align_ylabels() \
function Example\n\n', fontweight ="bold")

plt.show()
輸出:
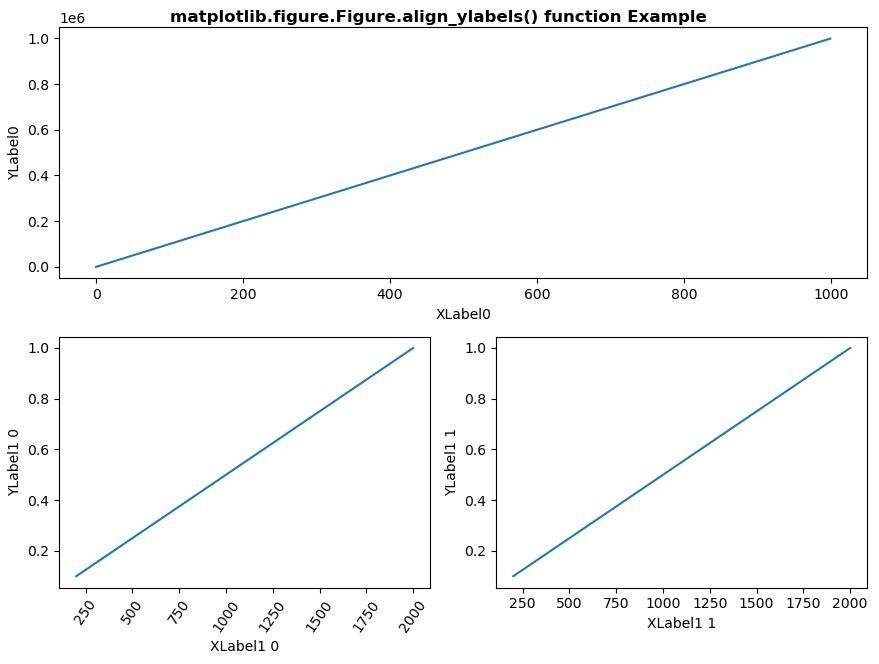
範例2:
# Implementation of matplotlib function
import matplotlib.pyplot as plt
import numpy as np
import matplotlib.gridspec as gridspec


fig = plt.figure(tight_layout = True)
gs = gridspec.GridSpec(2, 2)

ax = fig.add_subplot(gs[0,:])
ax.plot(np.arange(0, 1e6, 1000))

ax.set_ylabel('YLabel0')
ax.set_xlabel('XLabel0')

for i in range(2):
    ax = fig.add_subplot(gs[1, i])
    ax.plot(np.arange(1., 0., -0.1) * 2000.,
            np.arange(1., 0., -0.1))

    ax.set_ylabel('YLabel1 % d' % i)
    ax.set_xlabel('XLabel1 % d' % i)

    if i == 0:
        for tick in ax.get_xticklabels():
            tick.set_rotation(55)

fig.align_ylabels()

fig.suptitle('matplotlib.figure.Figure.align_ylabels()\
function Example\n\n', fontweight ="bold")

plt.show()
輸出:
相關用法
注:本文由純淨天空篩選整理自SHUBHAMSINGH10大神的英文原創作品 Matplotlib.figure.Figure.align_ylabels() in Python。非經特殊聲明,原始代碼版權歸原作者所有,本譯文未經允許或授權,請勿轉載或複製。