Matplotlib是Python中令人驚歎的可視化庫,用於二維陣列圖。 Matplotlib是一個基於NumPy數組的多平台數據可視化庫,旨在與更廣泛的SciPy堆棧配合使用。
matplotlib.colors.rgb_to_hsv()
matplotlib.colors.rgb_to_hsv()函數屬於matplotlib.colors模塊。的matplotlib.colors.rgb_to_hsv()函數用於將0到1範圍內的float rgb轉換為hsv值的numpy數組。
用法: matplotlib.colors.rgb_to_hsv(arr)
參數:
- arr:它是(_1,3)形式的array-like參數,其中所有值都必須在0到1的範圍內。
返回值:
- hsv:它以(…,3)的形式返回ndarray,該ndarray包含轉換為hsv值的顏色,範圍為0到1。
範例1:
import matplotlib.pyplot as plt
import matplotlib.colors as mcolors
# helper function to plot a
# color table
def colortable(colors, title,
colors_sort = True,
emptycols=0):
# cell dimensions
width = 212
height = 22
swatch_width = 48
margin = 12
topmargin = 40
# Sorting colors bbased on hue,
# saturation, value and name.
if colors_sort is True:
to_hsv = sorted((tuple(mcolors.rgb_to_hsv(mcolors.to_rgb(color))),
name)
for name, color in colors.items())
names = [name for hsv, name in to_hsv]
else:
names = list(colors)
length_of_names = len(names)
length_cols = 4 - emptycols
length_rows = length_of_names // length_cols + int(length_of_names % length_cols > 0)
width2 = width * 4 + 2 * margin
height2 = height * length_rows + margin + topmargin
dpi = 72
figure, axes = plt.subplots(figsize=(width2 / dpi, height2 / dpi),
dpi=dpi)
figure.subplots_adjust(margin/width2, margin/height2,
(width2-margin)/width2,
(height2-topmargin)/height2)
axes.set_xlim(0, width * 4)
axes.set_ylim(height * (length_rows-0.5), -height/2.)
axes.yaxis.set_visible(False)
axes.xaxis.set_visible(False)
axes.set_axis_off()
axes.set_title(title, fontsize=24, loc="left", pad=10)
for i, name in enumerate(names):
rows = i % length_rows
cols = i // length_rows
y = rows * height
swatch_start_x = width * cols
swatch_end_x = width * cols + swatch_width
text_pos_x = width * cols + swatch_width + 7
axes.text(text_pos_x, y, name, fontsize=14,
horizontalalignment='left',
verticalalignment='center')
axes.hlines(y, swatch_start_x, swatch_end_x,
color=colors[name], linewidth=18)
return figure
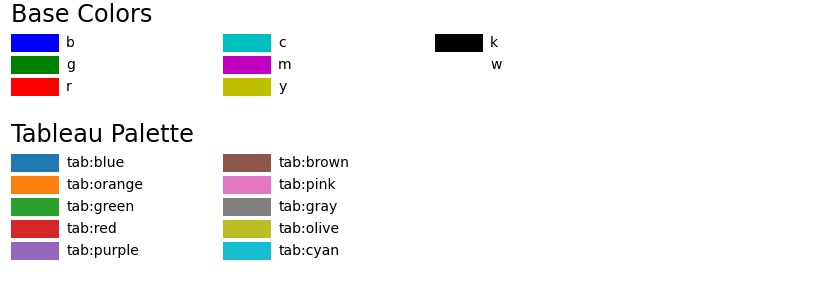
colortable(mcolors.BASE_COLORS, "Base Colors",
colors_sort=False, emptycols=1)
colortable(mcolors.TABLEAU_COLORS, "Tableau Palette",
colors_sort=False, emptycols=2)
colortable(mcolors.CSS4_COLORS, "CSS Colors")
plt.show()輸出:

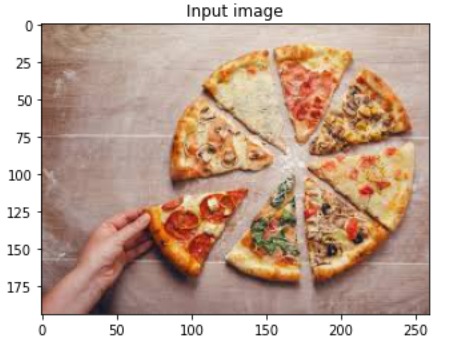
範例2:
使用的圖片:
import matplotlib
import matplotlib.pyplot as plt
import matplotlib.image as mpimg
image = mpimg.imread('food.jpeg')
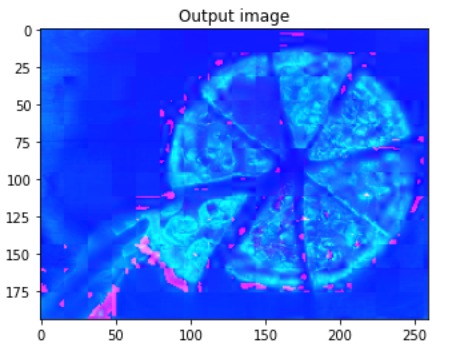
plt.title("Output image")
hsv = matplotlib.colors.rgb_to_hsv(image)
plt.imshow(hsv)
輸出:
相關用法
注:本文由純淨天空篩選整理自RajuKumar19大神的英文原創作品 Matplotlib.colors.rgb_to_hsv() in Python。非經特殊聲明,原始代碼版權歸原作者所有,本譯文未經允許或授權,請勿轉載或複製。