Matplotlib是Python中令人驚歎的可視化庫,用於二維陣列圖。 Matplotlib是一個基於NumPy數組的多平台數據可視化庫,旨在與更廣泛的SciPy堆棧配合使用。
matplotlib.colors.hsv_to_rgb()
matplotlib.colors.hsv_to_rgb()函數用於將hsv值轉換為rgb。
用法: matplotlib.colors.hsv_to_rgb(hsv)
參數:
- hsv:它是(_1,3)形式的array-like參數,其中所有值均假定為0到1。
返回值:
- rgb:它以(…,3)的形式返回ndarray,該ndarray包含轉換為RGB值的顏色,範圍為0到1。
範例1:
import matplotlib.pyplot as plt
import matplotlib.colors
import numpy as np
# helper function to find
# mid-points
def helper(z):
k = ()
for i in range(z.ndim):
z = (z[k + np.index_exp[:-1]] + z[k + np.index_exp[1:]]) / 2.0
k += np.index_exp[:]
return z
# dummy coordinates with rgb
# values attached with each
s, alpha, x = np.mgrid[0:1:11j,
0:np.pi*2:25j,
-0.5:0.5:11j]
a = s*np.cos(alpha)
b = s*np.sin(alpha)
sc, alphac, xc = helper(s), helper(alpha), helper(x)
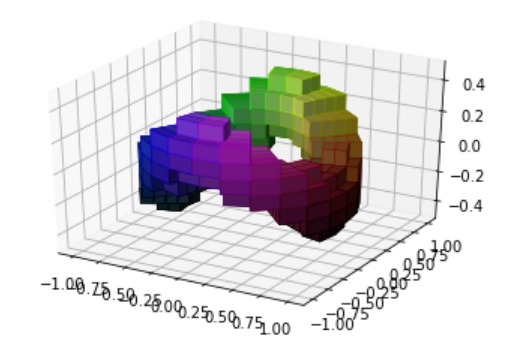
# wobbly torus about [0.7, *, 0]
sphere = (sc - 0.7)**2 + (xc + 0.2*np.cos(alphac*2))**2 < 0.2**2
# combining the color components
hsv = np.zeros(sphere.shape + (3,))
hsv[..., 0] = alphac / (np.pi*2)
hsv[..., 1] = sc
hsv[..., 2] = xc + 0.5
#the hsv to rgb function
plot_colors = matplotlib.colors.hsv_to_rgb(hsv)
# and plot everything
figure = plt.figure()
axes = figure.gca(projection='3d')
axes.voxels(a, b, x, sphere,
facecolors=plot_colors,
edgecolors=np.clip(2*plot_colors - 0.5, 0, 1),
linewidth=0.5)
plt.show()輸出:
範例2:
from matplotlib.colors import hsv_to_rgb

# sample squares for example
first_square = np.full((50, 50, 3),
                       fill_value ='698',
                       dtype = np.uint8) / 255.0

second_square = np.full((50, 50, 3),
                        fill_value ='385',
                        dtype = np.uint8) / 255.0

plt.subplot(1, 2, 1)
plt.imshow(hsv_to_rgb(first_square))

plt.subplot(1, 2, 2)
plt.imshow(hsv_to_rgb(second_square))

plt.show()
輸出:

相關用法
注:本文由純淨天空篩選整理自RajuKumar19大神的英文原創作品 Matplotlib.colors.hsv_to_rgb() in Python。非經特殊聲明,原始代碼版權歸原作者所有,本譯文未經允許或授權,請勿轉載或複製。