Matplotlib是Python中的一個庫,它是數字的-NumPy庫的數學擴展。它是Python中令人驚歎的可視化庫,用於數組的2D圖,並用於與更廣泛的SciPy堆棧配合使用。
Matplotlib.axis.Tick.update_from()函數
matplotlib庫的軸模塊中的Tick.update_from()函數用於將屬性從其他屬性複製到自身。
用法: Tick.update_from(self, other)
參數:此方法接受以下參數。
- other:此參數是要更新的屬性。
返回值:此方法不返回任何值。
以下示例說明了matplotlib.axis中的matplotlib.axis.Tick.update_from()函數:
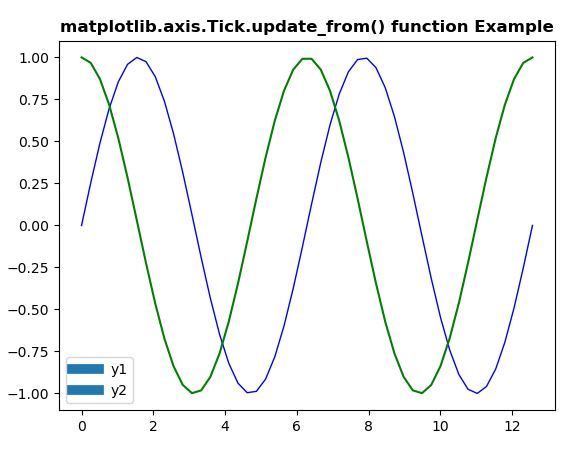
範例1:
Python3
# Implementation of matplotlib function
from matplotlib.axis import Tick
import numpy as np
import matplotlib.pyplot as plt
from matplotlib.legend_handler import HandlerLine2D


x = np.linspace(0, 4 * np.pi)
y1 = np.sin(x)
y2 = np.cos(x)

fig = plt.figure()

ax = fig.add_subplot(111)
ax.plot(x, y1, c ='b', label ='y1', linewidth = 1.0)
ax.plot(x, y2, c ='g', label ='y2')

linewidth = 7

def update(prop1, prop2):
    Tick.update_from(prop1, prop2)
    prop1.set_linewidth(7)

plt.legend(handler_map ={plt.Line2D:HandlerLine2D(update_func = update)})

ax.set_title('matplotlib.axis.Tick.update_from() \
function Example', fontweight ="bold")

plt.show()
輸出:
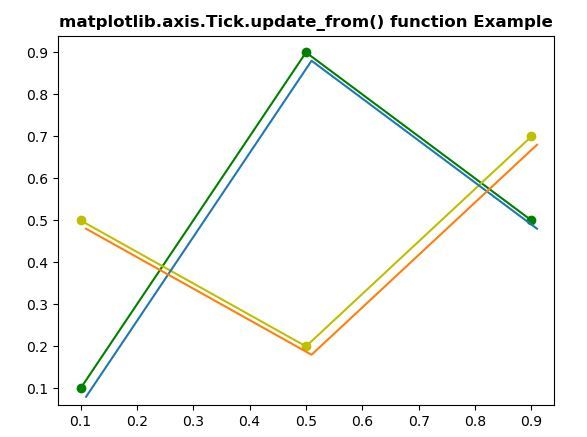
範例2:
Python3
# Implementation of matplotlib function
from matplotlib.axis import Tick
import numpy as np
import matplotlib.pyplot as plt
from matplotlib.legend_handler import HandlerLine2D
import matplotlib.transforms as mtransforms

fig, ax = plt.subplots()
l1, = ax.plot([0.1, 0.5, 0.9],
              [0.1, 0.9, 0.5],
              "go-")
l2, = ax.plot([0.1, 0.5, 0.9],
              [0.5, 0.2, 0.7],
              "yo-")

for l in [l1, l2]:

    xx = l.get_xdata()
    yy = l.get_ydata()

    shadow, = ax.plot(xx, yy)
    Tick.update_from(shadow, l)

    ot = mtransforms.offset_copy(l.get_transform(),
                                 ax.figure,
                                 x = 4.0,
                                 y =-6.0,
                                 units ='points')

    shadow.set_transform(ot)
ax.set_title('matplotlib.axis.Tick.update_from() \
function Example', fontweight ="bold")

plt.show()
輸出:
注:本文由純淨天空篩選整理自 Matplotlib.axis.Tick.update_from() function in Python。非經特殊聲明,原始代碼版權歸原作者所有,本譯文未經允許或授權,請勿轉載或複製。