Matplotlib是Python中的一個庫,它是數字的-NumPy庫的數學擴展。它是Python中令人驚歎的可視化庫,用於數組的2D圖,並用於與更廣泛的SciPy堆棧配合使用。
matplotlib.axis.Tick.set_gid()函數
matplotlib庫的軸模塊中的Tick.set_gid()函數用於設置藝術家的(組)ID。
用法: Tick.set_gid(self, gid)
參數:此方法接受以下參數。
- gid:此參數是作為gid給出的字符串。
返回值:此方法不返回任何值。
以下示例說明了matplotlib.axis中的matplotlib.axis.Tick.set_gid()函數:
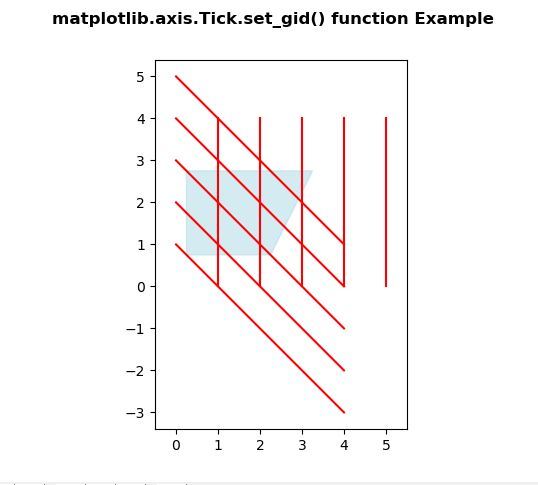
範例1:
Python3
# Implementation of matplotlib function
from matplotlib.axis import Tick
import numpy as np
import matplotlib.pyplot as plt


y, x = np.mgrid[:5, 1:6]
poly_coords = [
    (0.25, 2.75), (3.25, 2.75),
    (2.25, 0.75), (0.25, 0.75)
]

fig, ax = plt.subplots()

cells = ax.plot(x, y, x - y, color='red')
ax.add_patch(
    plt.Polygon(poly_coords,
                color='lightblue',
                alpha=0.5)
)

ax.margins(x=0.1, y=0.05)
ax.set_aspect('equal')

for i, t in enumerate(ax.patches):
    Tick.set_gid(t, 'patch_% d' % i)

fig.suptitle('matplotlib.axis.Tick.set_gid() \
function Example', fontweight ="bold")

plt.show()
輸出:
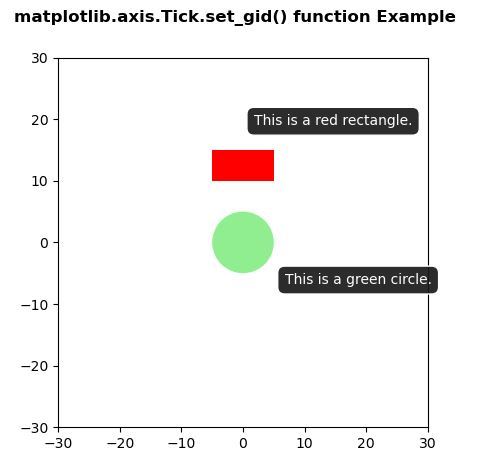
範例2:
Python3
# Implementation of matplotlib function
from matplotlib.axis import Tick
import numpy as np
import matplotlib.pyplot as plt


fig, ax = plt.subplots()

circle = plt.Circle((0, 0), 5, fc ='lightgreen')
rect = plt.Rectangle((-5, 10), 10, 5, fc ='red')

ax.add_patch(circle)
ax.add_patch(rect)

circle_tip = ax.annotate('This is a green circle.',
        xy =(0, 0),xytext =(30, -30), ha ='left',
        textcoords ='offset points',color ='w',
        bbox = dict(boxstyle ='round, pad =.5',
            fc =(.1, .1, .1, .92), ec =(1., 1., 1.),
            lw = 1, zorder = 1))

rect_tip = ax.annotate('This is a red rectangle.',
        xy =(-5, 10), xytext =(30, 40),color ='w',
        textcoords ='offset points', ha ='left',
        bbox = dict(boxstyle ='round, pad =.5',
            fc =(.1, .1, .1, .92), ec =(1., 1., 1.),
            lw = 1, zorder = 1))

for i, t in enumerate(ax.patches):
    Tick.set_gid(t, 'patch_% d'% i)

for i, t in enumerate(ax.texts):
    Tick.set_gid(t, 'tooltip_% d'% i)

ax.set_xlim(-30, 30)
ax.set_ylim(-30, 30)
ax.set_aspect('equal')

fig.suptitle('matplotlib.axis.Tick.set_gid() \
function Example', fontweight ="bold")

plt.show()
輸出:
注:本文由純淨天空篩選整理自 Matplotlib.axis.Tick.set_gid() function in Python。非經特殊聲明,原始代碼版權歸原作者所有,本譯文未經允許或授權,請勿轉載或複製。