Matplotlib是Python中的一個庫,它是數字的-NumPy庫的數學擴展。軸類包含大多數圖形元素:Axis,Tick,Line2D,Text,Polygon等,並設置坐標係。 Axes實例通過callbacks屬性支持回調。
matplotlib.axes.Axes.use_sticky_edges()函數
matplotlib庫的axiss模塊中的Axes.use_sticky_edges()函數用於是否遵循所有Artist.sticky_edges。
用法:
Axes.use_sticky_edges
以下示例說明了matplotlib.axes中的matplotlib.axes.Axes.use_sticky_edges()函數:
範例1:
# Implementation of matplotlib function
import numpy as np
import matplotlib.pyplot as plt

y, x = np.mgrid[:6, 1:6]
poly_coords = [
    (0.25, 2.75), (3.25, 2.75),
    (2.25, 0.75), (0.25, 0.75)
]
fig, ax = plt.subplots()

ax.use_sticky_edges = False

ax.pcolor(x, y, y + 20 * x, cmap ='Greens')

ax.margins(x = 0.1, y = 0.05)
ax.set_aspect('equal')

fig.suptitle('matplotlib.axes.Axes.use_sticky_edges() \
function Example\n', fontweight ="bold")
fig.canvas.draw()
plt.show()
輸出:

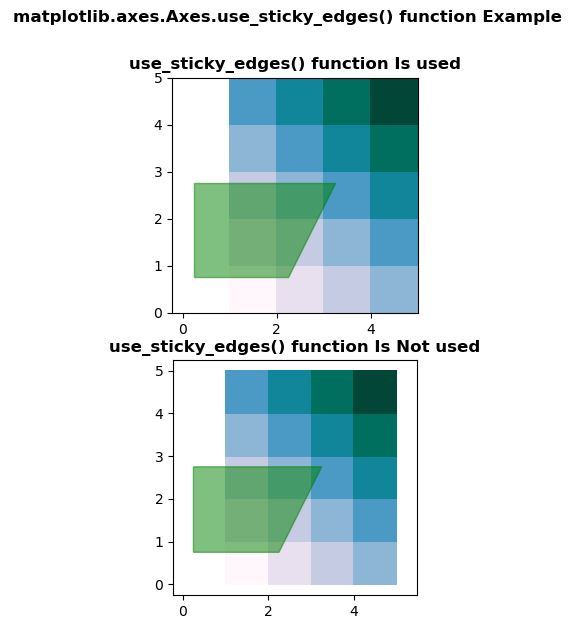
範例2:
# Implementation of matplotlib function
import numpy as np
import matplotlib.pyplot as plt

y, x = np.mgrid[:6, 1:6]
poly_coords = [
    (0.25, 2.75), (3.25, 2.75),
    (2.25, 0.75), (0.25, 0.75)
]
fig, (ax1, ax2) = plt.subplots(nrows = 2)

ax2.use_sticky_edges = False

for ax, status in zip((ax1, ax2),
                      ('Is', 'Is Not')):

    # sticky
    cells = ax.pcolor(x, y, x + y,
                      cmap ='PuBuGn')
    ax.add_patch(
        plt.Polygon(poly_coords, color ='green',
                    alpha = 0.5)
    )  # not sticky
    ax.margins(x = 0.1, y = 0.05)
    ax.set_aspect('equal')
    ax.set_title('use_sticky_edges() function {} used'.format(status),
                 fontweight ="bold")

fig.suptitle('matplotlib.axes.Axes.use_sticky_edges() function \
Example\n', fontweight ="bold")
fig.canvas.draw()
plt.show()
輸出:
相關用法
注:本文由純淨天空篩選整理自SHUBHAMSINGH10大神的英文原創作品 matplotlib.axes.Axes.use_sticky_edges() in Python。非經特殊聲明,原始代碼版權歸原作者所有,本譯文未經允許或授權,請勿轉載或複製。