Matplotlib是Python中的一個庫,它是數字的-NumPy庫的數學擴展。軸類包含大多數圖形元素:Axis,Tick,Line2D,Text,Polygon等,並設置坐標係。 Axes實例通過callbacks屬性支持回調。
matplotlib.axes.Axes.set_zorder()函數
matplotlib庫的axiss模塊中的Axes.set_zorder()函數用於設置藝術家的zorder。
用法: Axes.set_zorder(self, level)
參數:此方法僅接受一個參數。
- level:此參數包含浮點值。
返回值:此方法不返回任何值。
以下示例說明了matplotlib.axes中的matplotlib.axes.Axes.set_zorder()函數:
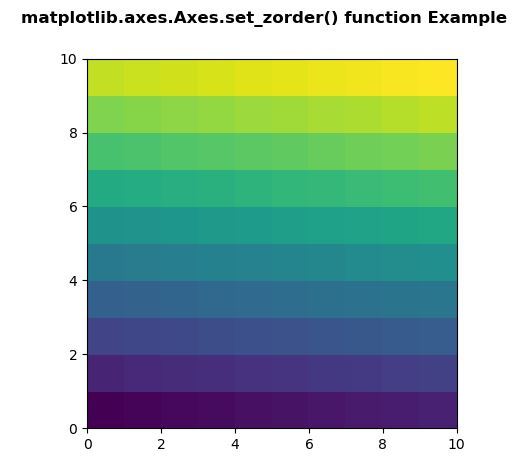
範例1:
# Implementation of matplotlib function
import numpy as np
import matplotlib.pyplot as plt

d = np.arange(100).reshape(10, 10)
xx, yy = np.meshgrid(np.arange(11), np.arange(11))

fig, ax = plt.subplots()

ax.set_aspect(1)
m = ax.pcolormesh(xx, yy, d)
m.set_zorder(-15)

fig.suptitle('matplotlib.axes.Axes.set_zorder() function\
 Example', fontweight ="bold")

plt.show()
輸出:
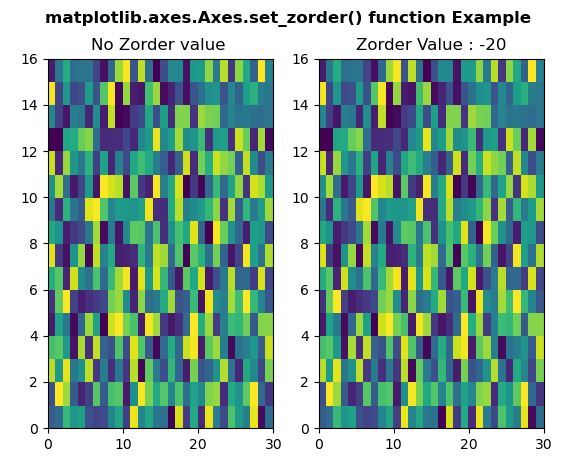
示例2:
# Implementation of matplotlib function
import numpy as np
import matplotlib.pyplot as plt

xx = np.random.rand(16, 30)

fig, (ax3, ax4) = plt.subplots(1, 2)

m = ax3.pcolor(xx)

ax3.set_title("No Zorder value ")

m = ax4.pcolor(xx)
m.set_zorder(-20)

ax4.set_title("Zorder Value:-20")

fig.suptitle('matplotlib.axes.Axes.set_zorder() \
function Example', fontweight ="bold")

plt.show()
輸出:
相關用法
注:本文由純淨天空篩選整理自SHUBHAMSINGH10大神的英文原創作品 Matplotlib.axes.Axes.set_zorder() in Python。非經特殊聲明,原始代碼版權歸原作者所有,本譯文未經允許或授權,請勿轉載或複製。