Matplotlib是Python中的一個庫,它是數字的-NumPy庫的數學擴展。軸類包含大多數圖形元素:Axis,Tick,Line2D,Text,Polygon等,並設置坐標係。 Axes實例通過callbacks屬性支持回調。
matplotlib.axes.Axes.set_ylabel()函數
matplotlib庫的axiss模塊中的Axes.set_ylabel()函數用於設置y軸的標簽。
用法: Axes.set_ylabel(self, xlabel, fontdict=None, labelpad=None, **kwargs)
參數:此方法接受以下參數。
- ylabel:此參數是標簽文本。
- labelpad:此參數是距軸邊界框的點距,包括刻度和刻度標簽。
返回值:此方法不返回任何值。
以下示例說明了matplotlib.axes中的matplotlib.axes.Axes.set_ylabel()函數:
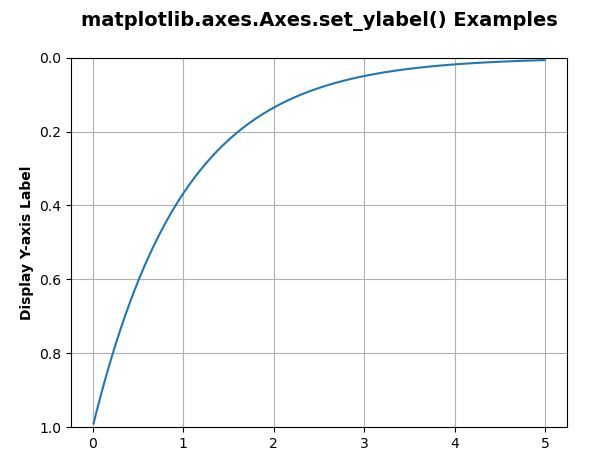
範例1:
import matplotlib.pyplot as plt
import numpy as np

t = np.arange(0.01, 5.0, 0.01)
s = np.exp(-t)

fig, ax = plt.subplots()

ax.plot(t, s)
ax.set_ylim(1, 0)
ax.set_ylabel('Display Y-axis Label',
              fontweight ='bold')
ax.grid(True)

ax.set_title('matplotlib.axes.Axes.set_ylabel() \
Examples\n', fontsize = 14, fontweight ='bold')
plt.show()
輸出:
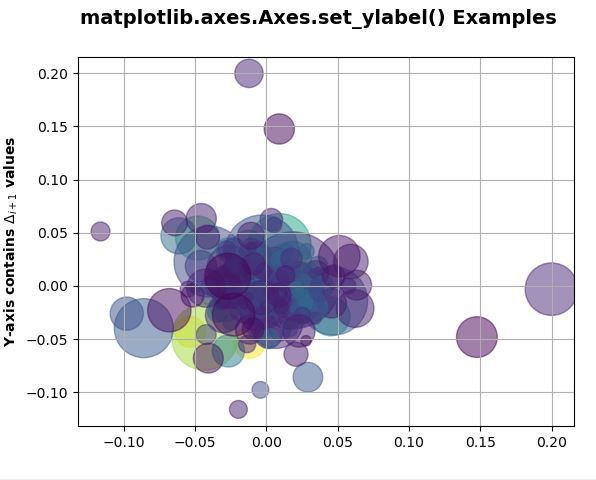
範例2:
#Implementation of matplotlib function
import numpy as np
import matplotlib.pyplot as plt
import matplotlib.cbook as cbook

with cbook.get_sample_data('goog.npz') as datafile:
    price_data = np.load(datafile)['price_data'].view(np.recarray)

# get the most recent 250
# trading days
price_data = price_data[-250:]

delta1 = np.diff(price_data.adj_close) / price_data.adj_close[:-1]

volume = (25 * price_data.volume[:-2] / price_data.volume[0])**(2.2)
close = (0.03 * price_data.close[:-2] / 0.03 * price_data.open[:-2])**2

fig, ax = plt.subplots()
ax.scatter(delta1[:-1], delta1[1:],
           c=close, s=volume,
           alpha=0.5)

ax.set_ylabel(r'Y-axis contains $\Delta_{i+1}$ values',
              fontweight='bold')
ax.grid(True)
fig.suptitle('matplotlib.axes.Axes.set_ylabel() Examples\n',
             fontsize=14, fontweight='bold')
plt.show()
輸出:
相關用法
注:本文由純淨天空篩選整理自SHUBHAMSINGH10大神的英文原創作品 Matplotlib.axes.Axes.set_ylabel() in Python。非經特殊聲明,原始代碼版權歸原作者所有,本譯文未經允許或授權,請勿轉載或複製。