Matplotlib是Python中的一個庫,它是數字的-NumPy庫的數學擴展。軸類包含大多數圖形元素:Axis,Tick,Line2D,Text,Polygon等,並設置坐標係。 Axes實例通過callbacks屬性支持回調。
matplotlib.axes.Axes.set_xticks()函數
matplotlib庫的axiss模塊中的Axes.set_xticks()函數用於設置帶有刻度列表的x刻度。
用法: Axes.set_xticks(self, ticks, minor=False)
參數:此方法接受以下參數。
- ticks:此參數是x軸刻度位置的列表。
- minor:此參數用於設置主要刻度線還是設置次要刻度線
返回值:此方法不返回任何值。
以下示例說明了matplotlib.axes中的matplotlib.axes.Axes.set_xticks()函數:
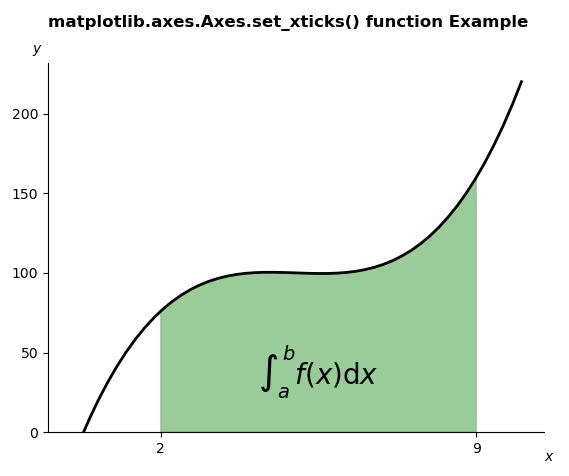
範例1:
# Implementation of matplotlib function
import numpy as np
import matplotlib.pyplot as plt
from matplotlib.patches import Polygon


def func(x):
    return (x - 4) * (x - 6) * (x - 5) + 100


a, b = 2, 9  # integral limits
x = np.linspace(0, 10)
y = func(x)

fig, ax = plt.subplots()
ax.plot(x, y, "k", linewidth = 2)
ax.set_ylim(bottom = 0)

# Make the shaded region
ix = np.linspace(a, b)
iy = func(ix)
verts = [(a, 0), *zip(ix, iy), (b, 0)]
poly = Polygon(verts, facecolor ='green',
               edgecolor ='0.5', alpha = 0.4)
ax.add_patch(poly)

ax.text(0.5 * (a + b), 30,
        r"$\int_a ^ b f(x)\mathrm{d}x$",
        horizontalalignment ='center',
        fontsize = 20)

fig.text(0.9, 0.05, '$x$')
fig.text(0.1, 0.9, '$y$')

ax.spines['right'].set_visible(False)
ax.spines['top'].set_visible(False)
ax.set_xticks((a, b))

fig.suptitle('matplotlib.axes.Axes.set_xticks()\
 function Example\n\n', fontweight ="bold")
fig.canvas.draw()
plt.show()
輸出:
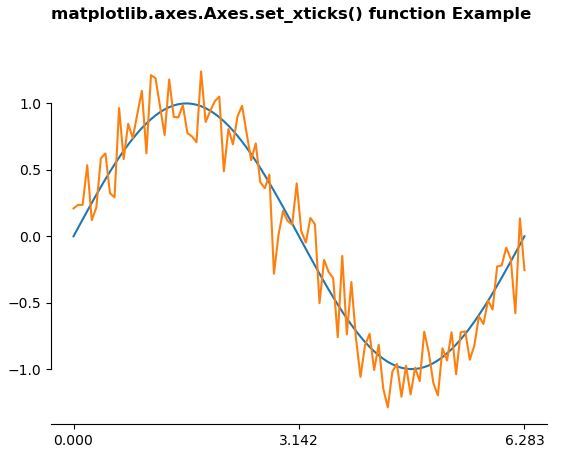
範例2:
# Implementation of matplotlib function
import numpy as np
import matplotlib.pyplot as plt

# Fixing random state for reproducibility
np.random.seed(19680801)

x = np.linspace(0, 2 * np.pi, 100)
y = np.sin(x)
y2 = y + 0.2 * np.random.normal(size = x.shape)

fig, ax = plt.subplots()
ax.plot(x, y)
ax.plot(x, y2)

ax.set_xticks([0, np.pi, 2 * np.pi])

ax.spines['left'].set_bounds(-1, 1)
ax.spines['right'].set_visible(False)
ax.spines['top'].set_visible(False)

fig.suptitle('matplotlib.axes.Axes.set_xticks() \
function Example\n\n', fontweight ="bold")
fig.canvas.draw()
plt.show()
輸出:
注:本文由純淨天空篩選整理自SHUBHAMSINGH10大神的英文原創作品 Matplotlib.axes.Axes.set_xticks() in Python。非經特殊聲明,原始代碼版權歸原作者所有,本譯文未經允許或授權,請勿轉載或複製。