Matplotlib是Python中的一個庫,它是數字的-NumPy庫的數學擴展。軸類包含大多數圖形元素:Axis,Tick,Line2D,Text,Polygon等,並設置坐標係。 Axes實例通過callbacks屬性支持回調。
matplotlib.axes.Axes.set_path_effects()函數
matplotlib庫的axiss模塊中的Axes.set_path_effects()函數用於設置路徑效果。
用法: Axes.set_path_effects(self, path_effects)
參數:此方法僅接受一個參數。
- path_effects:此參數是AbstractPathEffect。
返回值:此方法不返回任何值。
以下示例說明了matplotlib.axes中的matplotlib.axes.Axes.set_path_effects()函數:
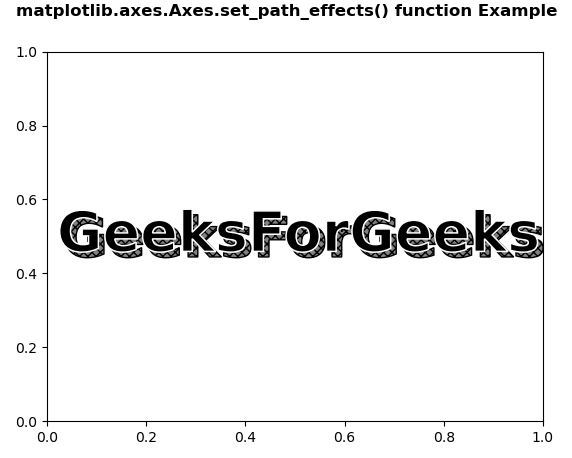
範例1:
# Implementation of matplotlib function
import matplotlib.pyplot as plt
import numpy as np
import matplotlib.patheffects as path_effects


fig, ax = plt.subplots()
t = ax.text(0.02, 0.5,
            'GeeksForGeeks',
            fontsize = 40,
            weight = 1000,
            va ='center')

t.set_path_effects([path_effects.PathPatchEffect(offset =(4, -4),
                                                 hatch ='xxxx',
                                                 facecolor ='gray'),
                    path_effects.PathPatchEffect(edgecolor ='white',
                                                 linewidth = 1.1,
                                                 facecolor ='black')])

fig.suptitle('matplotlib.axes.Axes.set_path_effects() function\
Example\n', fontweight ="bold")

plt.show()
輸出:
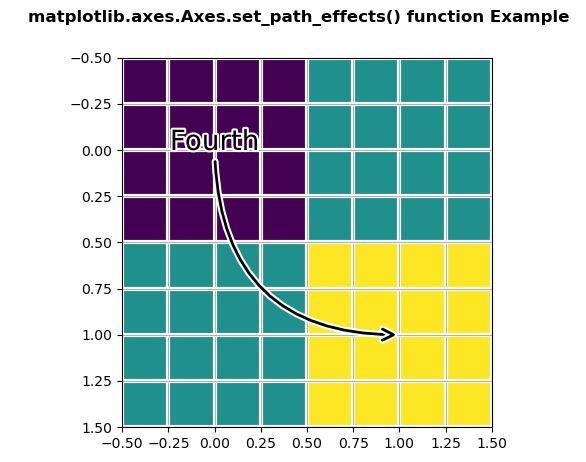
範例2:
# Implementation of matplotlib function
import matplotlib.pyplot as plt
import matplotlib.patheffects as PathEffects
import numpy as np


fig, ax1 = plt.subplots()
ax1.imshow([[1, 2], [2, 3]])

txt = ax1.annotate("Fourth",
                   (1., 1.),
                   (0., 0),
                   arrowprops = dict(arrowstyle ="->",
                                     connectionstyle ="angle3",
                                     lw = 2),
                   size = 20, ha ="center",
                   path_effects =[PathEffects.withStroke(linewidth = 3,
                                                         foreground ="w")])

txt.arrow_patch.set_path_effects([
    PathEffects.Stroke(linewidth = 5,
                       foreground ="w"),
    PathEffects.Normal()])

ax1.grid(True, linestyle ="-")

pe = [PathEffects.withStroke(linewidth = 3,
                             foreground ="w")]

for l in ax1.get_xgridlines() + ax1.get_ygridlines():
    l.set_path_effects(pe)

fig.suptitle('matplotlib.axes.Axes.set_path_effects() \
function Example\n', fontweight ="bold")

plt.show()
輸出:
相關用法
注:本文由純淨天空篩選整理自SHUBHAMSINGH10大神的英文原創作品 Matplotlib.axes.Axes.set_path_effects() in Python。非經特殊聲明,原始代碼版權歸原作者所有,本譯文未經允許或授權,請勿轉載或複製。