Matplotlib是Python中的一個庫,它是數字的-NumPy庫的數學擴展。軸類包含大多數圖形元素:Axis,Tick,Line2D,Text,Polygon等,並設置坐標係。 Axes實例通過callbacks屬性支持回調。
matplotlib.axes.Axes.set_navigate_mode()函數
matplotlib庫的axiss模塊中的Axes.set_navigate_mode()函數用於設置導航工具欄按鈕狀態。
用法: Axes.set_navigate_mode(self, b)
參數:此方法接受以下參數。
- b:此參數是導航模式值。
返回值:此方法不返回任何值。
以下示例說明了matplotlib.axes中的matplotlib.axes.Axes.set_navigate_mode()函數:
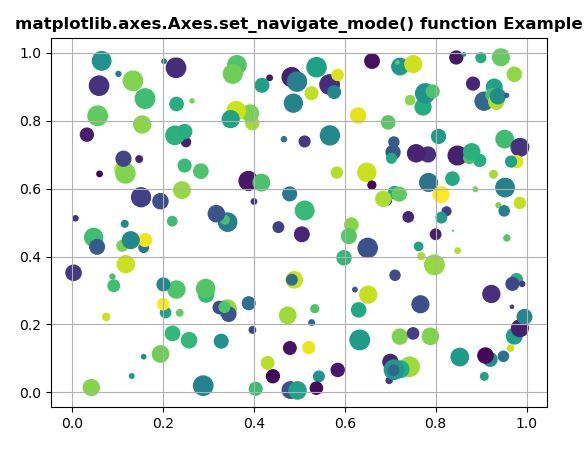
範例1:
# Implementation of matplotlib function
import numpy as np
import matplotlib.pyplot as plt
np.random.seed(19680801)

fig, ax = plt.subplots()

x, y, s, c = np.random.rand(4, 200)
s *= 200

ax.scatter(x, y, s, c)
ax.set_navigate_mode("ZOOM")

ax.set_title('matplotlib.axes.Axes.set_navigate_mode()\
 function Example', fontweight ="bold")

ax.grid()

plt.show()
輸出:
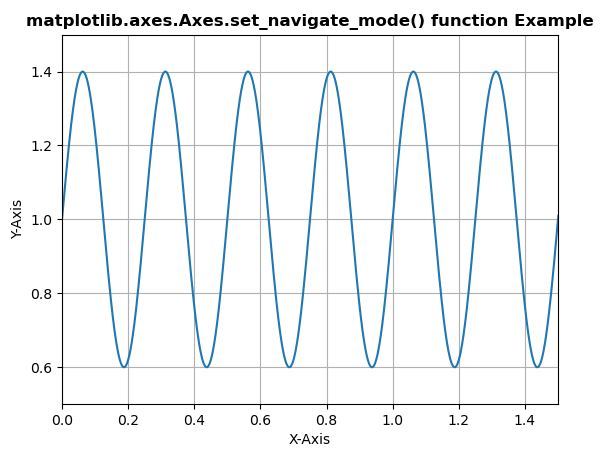
範例2:
# Implementation of matplotlib function
import matplotlib
import matplotlib.pyplot as plt
import numpy as np

t = np.arange(0.0, 2, 0.001)
s = 1 + np.sin(8 * np.pi * t)*0.4

fig, ax = plt.subplots()
ax.plot(t, s)

ax.set_navigate_mode("PAN")

ax.set(xlabel ='X-Axis', ylabel ='Y-Axis',
       xlim =(0, 1.5), ylim =(0.5, 1.5))

ax.set_title('matplotlib.axes.Axes.set_navigate_mode()\
 function Example', fontweight ="bold")

ax.grid()
plt.show()
輸出:
相關用法
注:本文由純淨天空篩選整理自SHUBHAMSINGH10大神的英文原創作品 Matplotlib.axes.Axes.set_navigate_mode() in Python。非經特殊聲明,原始代碼版權歸原作者所有,本譯文未經允許或授權,請勿轉載或複製。