Matplotlib是Python中的一個庫,它是數字的-NumPy庫的數學擴展。軸類包含大多數圖形元素:Axis,Tick,Line2D,Text,Polygon等,並設置坐標係。 Axes實例通過callbacks屬性支持回調。
matplotlib.axes.Axes.set_axisbelow()函數
matplotlib庫的axiss模塊中的Axes.set_axisbelow()函數用於設置軸刻度和網格線是高於還是低於大多數美術師。
用法: Axes.set_axisbelow(self, b)
參數:此方法僅接受一個參數。
- b:此參數包含一個布爾值,可能的值為:True,False或“line”。
返回值:此方法不返回任何內容。
以下示例說明了matplotlib.axes中的matplotlib.axes.Axes.set_axisbelow()函數:
範例1:
# Implementation of matplotlib function
import matplotlib.pyplot as plt
import numpy as np
# Random test data
np.random.seed(19680801)
all_data = [np.random.normal(0, std, size = 100) for std in range(1, 6)]
labels = ['x1', 'x2', 'x3', 'x4', 'x5']
fig, ax = plt.subplots()
bplot = ax.boxplot(all_data,
vert = True,
patch_artist = True,
labels = labels)
colors = ['lightpink', 'lightblue', 'lightgreen',
"lightgrey", "yellow"]
for patch, color in zip(bplot['boxes'], colors):
patch.set_facecolor(color)
ax.yaxis.grid(True, color ="green", lw = 2)
ax.set_axisbelow(True)
ax.set_xlabel('Samples')
ax.set_ylabel('Observed values')
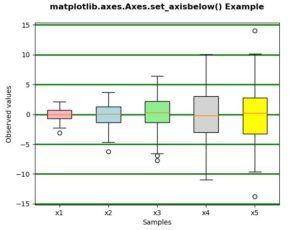
ax.set_title('matplotlib.axes.Axes.set_axisbelow() \
Example\n', fontsize = 12, fontweight ='bold')
plt.show()輸出:
範例2:
# Implementation of matplotlib function
import matplotlib.pyplot as plt
import numpy as np

# Random test data
np.random.seed(19680801)
all_data = [np.random.normal(0, std, size = 100) for std in range(1, 6)]
labels = ['x1', 'x2', 'x3', 'x4', 'x5']

fig, ax = plt.subplots()

bplot = ax.boxplot(all_data,
                     vert = True,
                     patch_artist = True,
                     labels = labels)
colors = ['lightpink', 'lightblue', 'lightgreen',
          "lightgrey", "yellow"]
for patch, color in zip(bplot['boxes'], colors):
    patch.set_facecolor(color)

ax.yaxis.grid(True, color ="green", lw = 2)
ax.set_axisbelow(False)
ax.set_xlabel('Samples')
ax.set_ylabel('Observed values')
ax.set_title('matplotlib.axes.Axes.set_axisbelow()\
 Example\n', fontsize = 12, fontweight ='bold')
plt.show()
輸出:

注:本文由純淨天空篩選整理自SHUBHAMSINGH10大神的英文原創作品 Matplotlib.axes.Axes.set_axisbelow() in Python。非經特殊聲明,原始代碼版權歸原作者所有,本譯文未經允許或授權,請勿轉載或複製。